The Global Lakes Explorer
An interactive app for researchers and policymakers to visualise, compare and download nutrient emission data across regions and sectors.
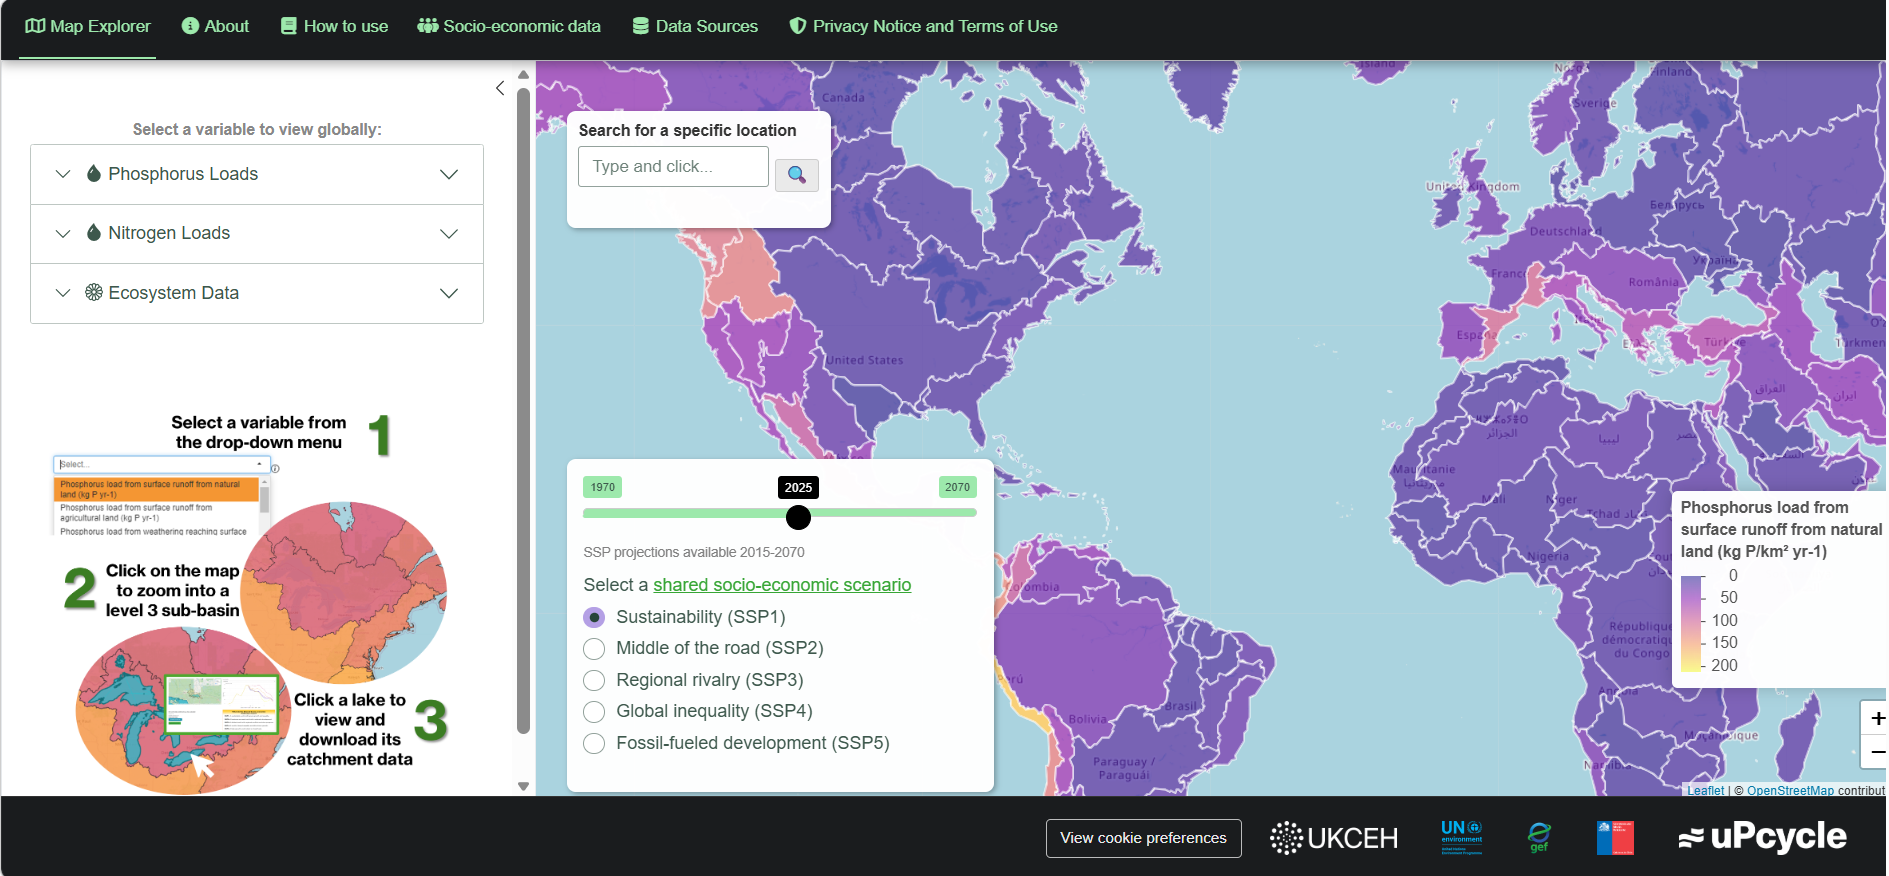
Features basin- and catchment-scale nutrient pressures and future runoff scenarios for over 40,000 lake catchments globally. The app also includes a national-scale socioeconomics data, with information on national environmental indicators and phosphate trade statistics. A 'How to Use' tab features ready-to-paste code snippets in both R and Python. These scripts enable users to import our data and perform customised analyses for their own lake catchments. Detailed metadata of all variables included in the dataset.
How to use
Select a variable (e.g., phosphorus runoff, land use) from the dropdown — the map will update automatically.
Zoom or pan the map to your region of interest. Click a hydrobasin to view the lakes within it.
Click a specific lake to open a statistics card with charts and summary metrics.
Use the Scenario/Year controls to view SSP projections and compare future outcomes.
Download CSVs for the selected lake, basin, or all catchments using the download button.
Visit the Socio‑Economic and Data Sources tabs to download supporting datasets and metadata.
The Metadatabase
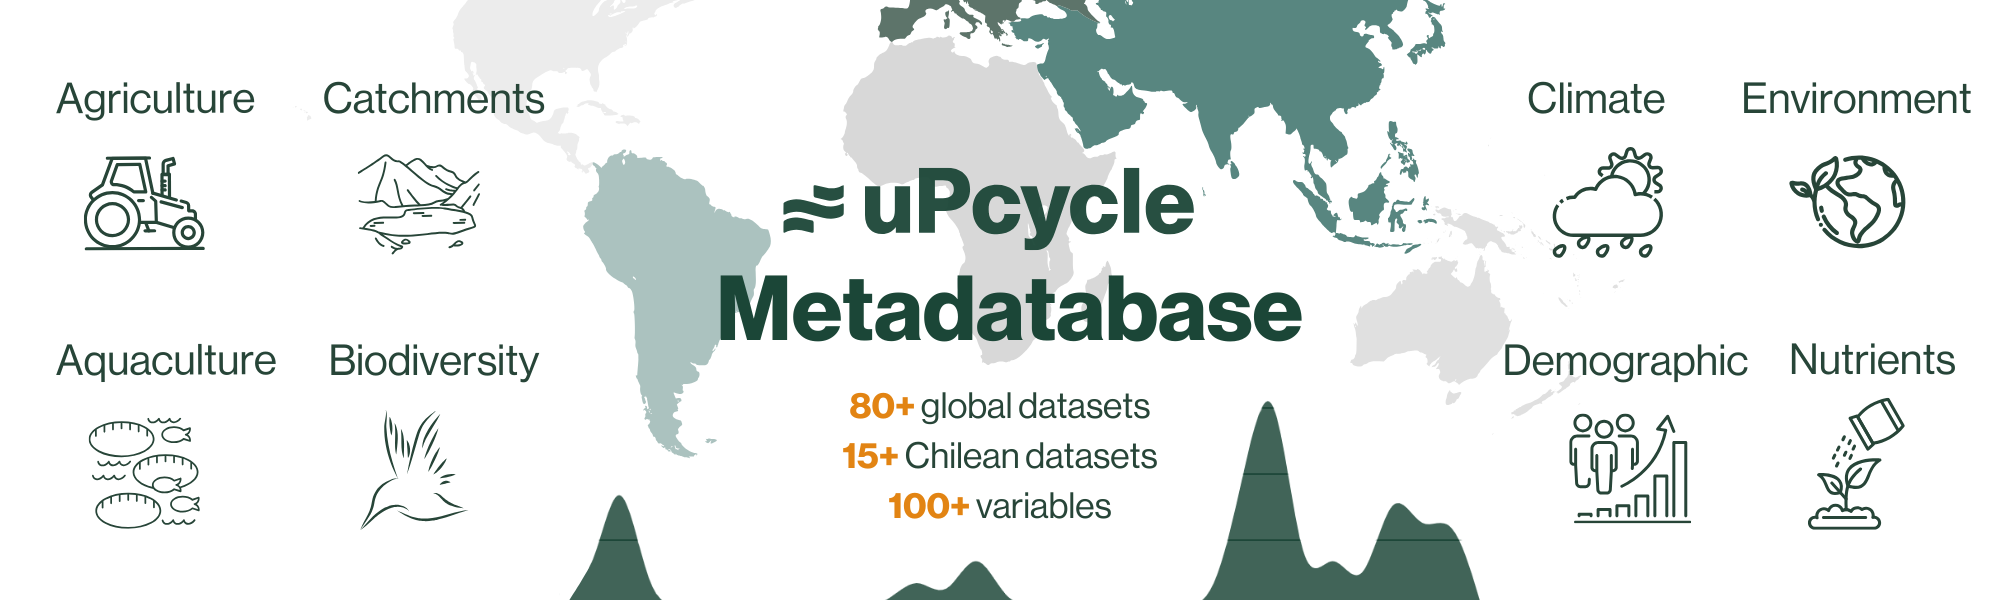
Datasets used in the Global Lakes Explorer can also be found in the metadatabase, an online catalogue of metadata relevant datasets, including information about data scope and availability. Collects 80+ global datasets, 15+ Chilean datasets, 100+ variables.