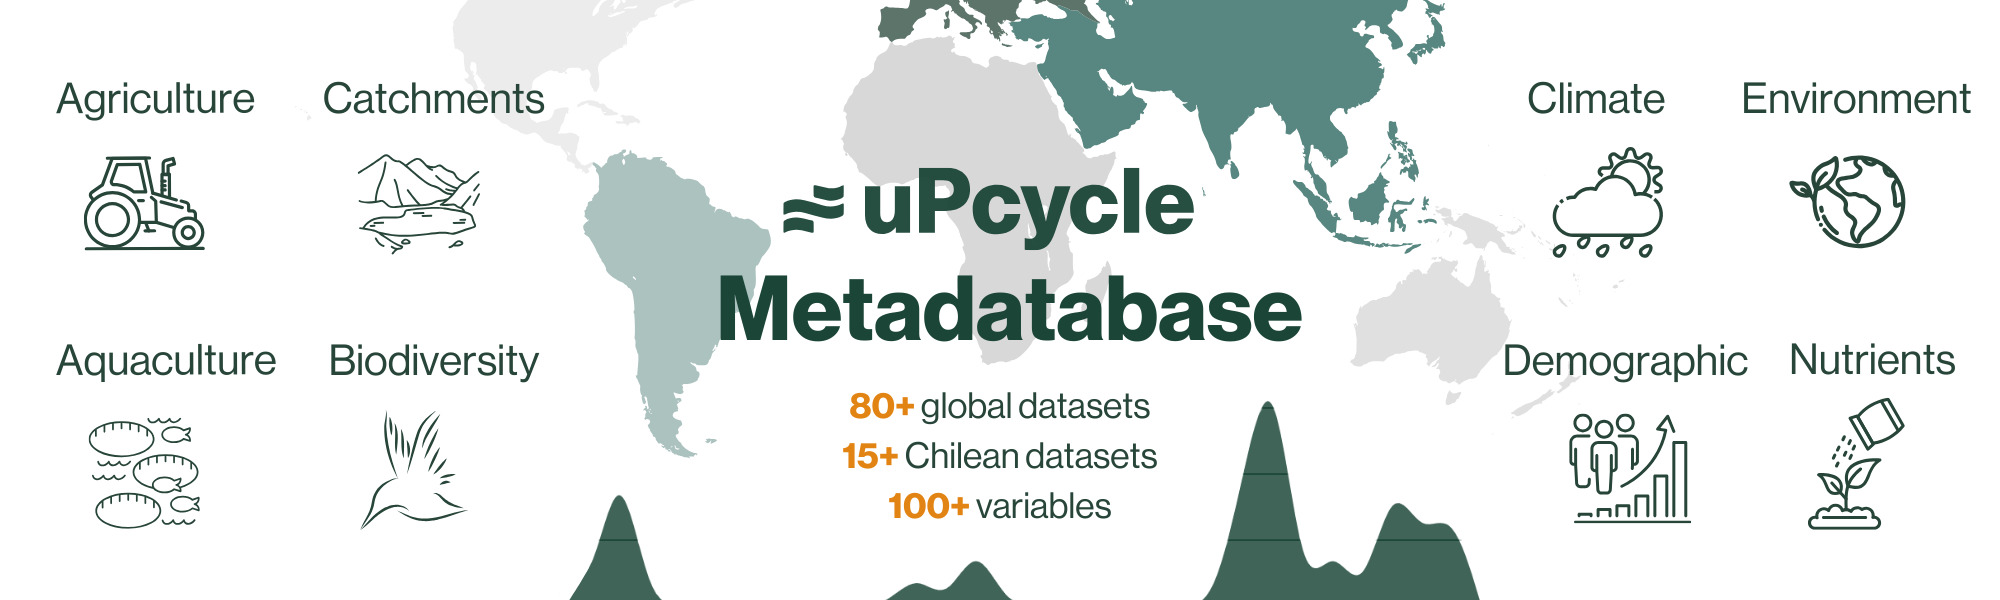
Global Datasets
uP1 Population densityuP2 Large Marine Ecosystems (LMEs)
uP3 Urban extents
uP4 Nitrogen and Phosphorus delivery
uP5 Global Gridded Relative Deprivation Index (GRDI) Version 1 (GRDIv1)
uP6 OECD Global Agriculture
uP7 Agricultural and fishery GDP
uP8 Global Phosphorus Losses from Croplands under Future Precipitation Scenarios
uP9 Fertilizer use by crop and by country
uP10 Soil Plant Available Phosphorus
uP11 Land-side aquaculture Ponds Distribution
uP12 Patterns and drivers of soil total phosphorus concentration
uP13 Phosphorus in agricultural soils
uP14 Phosphorus transfers in global fisheries and aquaculture
uP15 Future climate projections (CMIP6)
uP16 Historical climate data (WorldClim version 2.1)
uP17 Soil Phosphorus Distribution
uP18 HydroBASINS
uP19 HydroLAKES
uP20 HydroRIVERS
uP21 Elevation
uP22 MARINA-Multi - Pollution due to livestock production
uP23 MARINA-Multi - Pollution due to urbanization
uP24 MARINA-Multi - Pollution due to urbanization and agriculture
uP25 MARINA-Nutrients - Nutrients (N and P) from sub-basins
uP26 SGD Water Quality Hub
uP27 Aqueduct Water Risk Atlas
uP28 BasinATLAS (HydroATLAS)
uP29 RiverATLAS (HydroATLAS)
uP30 LakeATLAS (HydroATLAS)
uP31 HydroSHEDS v2 (under development)
uP32 GEMSTAT data portal
uP34 Global Lakes and Wetlands Database (GLWD)
uP35 GLO-30 Digital Elevation Model
uP36 GLO-90 Digital Elevation Model
uP37 GloboLakes: Lake Surface Water Temperature (LSWT) v4.0 (1995-2016)
uP38 GloboLakes: high-resolution global limnology dataset v1
uP39 Global Biodiversity Information Facility (GBIF)
uP40 Global Fishing Watch
uP41 Global Aquaculture Imports and Exports
uP42 Global aquaculture production Quantity (1950 - 2021)
uP43 Harmonized World Soil Database v2.0 (HWSD)
uP44 Per capita water withdrawal
uP45 Freshwater use in agriculture
uP46 Share of agricultural land that is irrigated
uP47 Industrial water withdrawal
uP48 Municipal water withdrawal
uP49 Water quality of global lakes
uP50 LIMNADES (Lake bio-optical measurements and match-up data for remote sensing)
uP51 Cost and Affordability of a Healthy Diet (CoAHD)
uP52 Life expectancy
uP53 Global Subnational Infant Mortality Rates
uP54 Cancer incidence
uP55 Health expenditure as a share of GDP
uP56 Government health expenditure as share of GDP
uP57 In Situ Global Lakes & Reservoirs
uP73 Lake-TopoCat
uP74 ISIMIP3ab Simulation Data from the Global Lakes Sector: soil input
uP75 ISIMIP2ab Simulation Data from the Global Lakes Sector: windspeed (historical and projected)
uP76 CLARA-A3: CM SAF cLoud, Albedo and surface RAdiation dataset from AVHRR data - Edition 3
uP77 World Bank GDP (current $)
uP78 World Bank GDP growth
uP79 Country Boundaries (various)
uP82 MERRA2 Wind Data
uP83 BACI Phosphorus
uP84 WITS Phosphorus
uP85 Resource Trade Phosphorus
uP86 GloboLakes chl-a
uP88 Global Aridity Index and Potential Evapotranspiration Climate Database v3 (historical and future)
uP90 Global Peatland Database
uP91 Precipitation (historical and projected)
uP92 Cropland Nutrient Balance (including nutrient use efficiency)
uP93 IUCN Red List of Threatened Species
uP94 Framework for Ecosytem Restoration Monitoring (FERM)
uP95 Index of coastal eutrophication potential
uP96 Red List Index
uP97 Average proportion of Freshwater/Terrestrial Key Biodiversity Areas (KBAs) covered by protected areas (%)
uP98 World Database on Protected Areas (WDPA)
uP99 Land Surface Runoff
uP100 Land cover classes and extent
uP101 Potential natural vegetation classes and extent
uP102 GLW 4: Gridded Livestock Density
uP103 Global phosphorus losses due to soil erosion
uP104 UN countries
Country-specific Datasets
uP33 Nutrient ExplorerChilean (Comp 3) Datasets
uP58 Terrestrial ecosystems (SIMBIO)uP59 Marine ecosystems
uP60 Wetlands
uP61 Species restoration, conservation and management
uP62 Ecological restoration
uP63 Species taxonomy
uP64 Protected areas
uP65 Areas of other designations
uP66 Priority sites
uP67 Private conservation sites
uP68 Catchments, subcatchments and sub-sub-catchments
uP69 Regions, provinces and communes
uP70 Water Agency probe data
uP71 Regional land use
uP72 Biodiversity (species presence/absence, ecosystem classification, protected areas, etc.)
uP80 Chile Boundaries (various)
uP81 Chile Catchments
Global Datasets
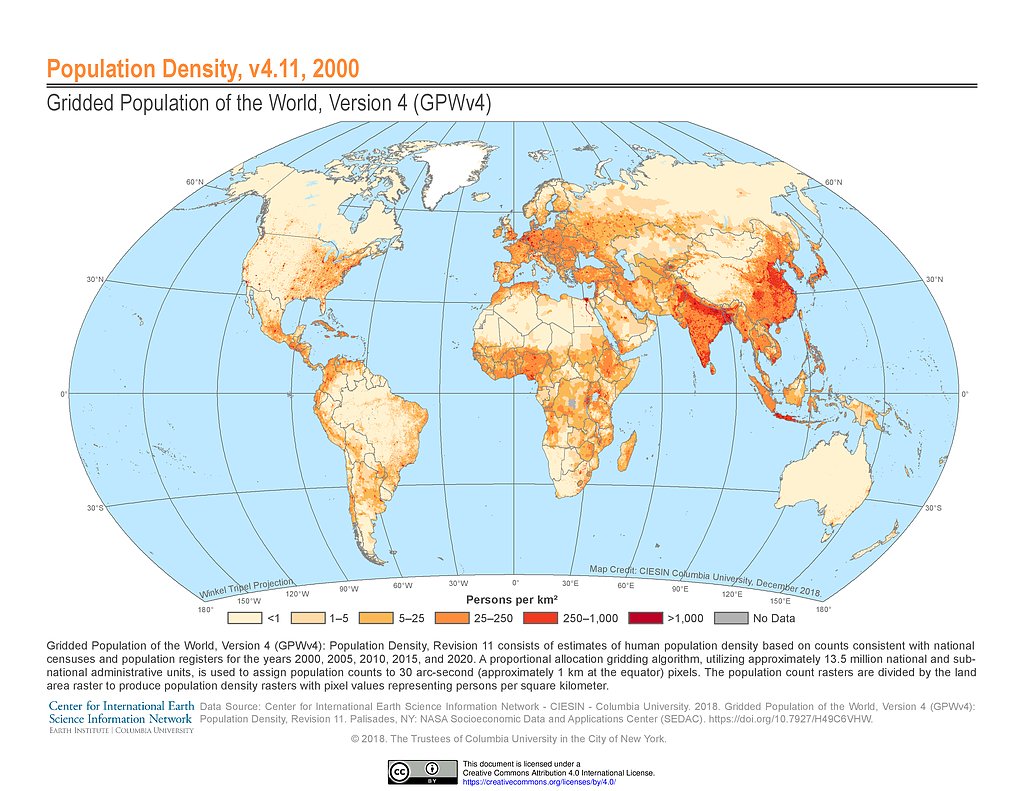
uP1 Population density ⇑
🌐 https://sedac.ciesin.columbia.edu/data/set/gpw-v4-population-density-rev11/data-downloadDescription: Gridded Population of the World, Version 4 (GPWv4)
Model / methods: Based on counts consistent with national censuses and population registers, as raster data to facilitate data integration.
| Scope: | Global |
| Category: | Demographic |
| Data type: | GeoTIFF, ASCII, and netCDF-4 |
| Resolution: | 30 arc-second, 2.5 minute, 15 minute, 30 minute, 1 degree |
| Timepoints: | 2000, 2005, 2010, 2015, and 2020. |
| Units: | Number of persons per pixel |
Availability: Available to download
Licence: When authors make use of data they should cite both the data set and the scientific publication, if available. Such a practice gives credit to data set producers and advances principles of transparency and reproducibility. Please visit the data citations page (https://sedac.ciesin.columbia.edu/citations) for details. Users who would like to choose to format the citation(s) for this dataset using a myriad of alternate styles can copy the DOI number and paste it into Crosscite's website.
Reference: Center for International Earth Science Information Network - CIESIN - Columbia University. 2018. Gridded Population of the World, Version 4 (GPWv4): Population Density, Revision 11. Palisades, New York: NASA Socioeconomic Data and Applications Center (SEDAC). https://doi.org/10.7927/H49C6VHW. Accessed DAY MONTH YEAR.
uP2 Large Marine Ecosystems (LMEs) ⇑
🌐 https://www.sciencebase.gov/catalog/item/55c77722e4b08400b1fd8244Description: Large areas of ocean space of approximately 200,000 sq km; or greater, adjacent to the continents in coastal waters where primary productivity is generally higher than in open ocean areas.
Model / methods: defined by ecological criteria, including bathymetry, hydrography, productivity, and trophically linked populations
| Scope: | Global |
| Category: | Catchments |
| Data type: | Comma separated values (.csv) and GeoJSON |
| Resolution: | 200,000 km2 |
| Units: | km2 |
Availability: Available to download
Reference: Sherman, K., Shuford, R.L., Adams, S. and Bosch, J., 2017. Large Marine Ecosystems. US Geological Survey Data Release, https://www.sciencebase.gov/catalog/item/55c77722e4b08400b1fd8244
uP3 Urban extents ⇑
🌐 https://figshare.com/articles/dataset/A_global_dataset_of_annual_urban_extents_1992-2020_from_harmonized_nighttime_lights/16602224/1Description: Global dataset of annual urban extents
Model / methods: Harmonized time-series nighttime light (NTL) composites by fusing multisource NTL observations. The harmonized global NTL dataset used as the primary dataset for mapping the global time-series urban extents is available at https://doi.org/10.6084/m9.figshare.9828827.v5
| Scope: | Global |
| Category: | Demographic |
| Data type: | GeoTIFF |
| Resolution: | 30 arcsec (∼ 1 km) |
| Timepoints: | 1992-2020 |
| Units: | 0 and 1 |

Availability: Available to download
Licence: CC-BY-4.0
Reference: Zhao, M., Cheng, C., Zhou, Y., Li, X., Shen, S., and Song, C.: A global dataset of annual urban extents (1992–2020) from harmonized nighttime lights, Earth Syst. Sci. Data, 14, 517–534, https://doi.org/10.5194/essd-14-517-2022, 2022.
uP4 Nitrogen and Phosphorus delivery ⇑
🌐 https://dataportaal.pbl.nl/downloads/IMAGE/GNM/Description: N and P delivery to surface water and in-stream transport and retention processes in streams, rivers, lakes, wetlands and reservoirs
Model / methods: IMAGE-GNM (Global Nutrient Model) coupled with PCR-GLOBWB (Pcraster-Global Water Balance)
| Scope: | Global |
| Category: | Nutrients |
| Data type: | NetCDF (.nc) |
| Resolution: | 0.5 by 0.5 degrees |
| Timepoints: | 1970, 1975, 1980, 1985, 1990, 1995, 2000, 2005, 2010, 2015, 2020, 2025, 2030, 2035, 2040, 2045, 2050, 2055, 2060, 2065, 2070 |
| Units: | Tg/yr |
| SSP(s): | SSP1, SSP2, SSP3, SSP4, SSP5 |
Availability: Available to download
Licence: The paper is under CC-BY-4.0 DEED: https://creativecommons.org/licenses/by/4.0/
Reference: A.H.W. Beusen, J.C. Doelman, L.P.H. Van Beek, P.J.T.M. Van Puijenbroek, J.M. Mogollón, H.J.M. Van Grinsven, E. Stehfest, D.P. Van Vuuren, A.F. Bouwman, Exploring river nitrogen and phosphorus loading and export to global coastal waters in the Shared Socio-economic pathways, Global Environmental Change, Volume 72, 2022, 102426, ISSN 0959-3780, https://doi.org/10.1016/j.gloenvcha.2021.102426.
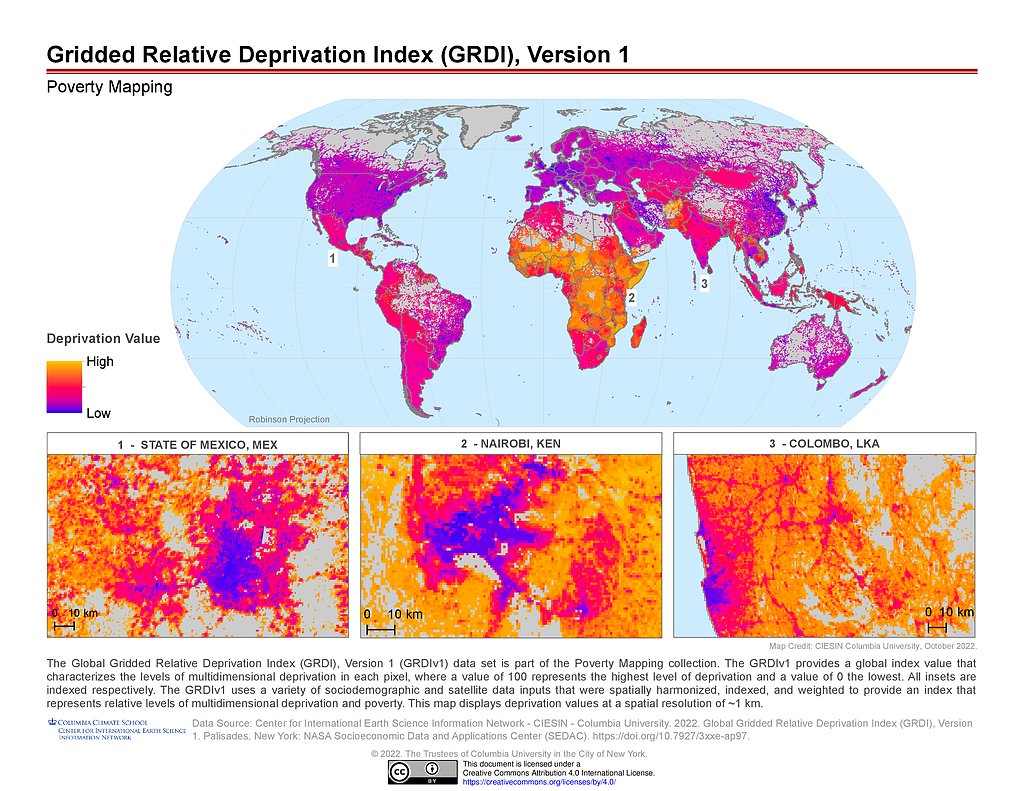
uP5 Global Gridded Relative Deprivation Index (GRDI) Version 1 (GRDIv1) ⇑
🌐 https://sedac.ciesin.columbia.edu/data/set/povmap-grdi-v1/data-downloadDescription: Global gridded relative levels of multidimensional deprivation and poverty per pixel. Value of 100 represents the highest level of deprivation and a value of 0 the lowest.
Model / methods: GRDIv1 is built from sociodemographic and satellite data inputs that were spatially harmonized, indexed, and weighted into six main components to produce the final index raster. Inputs were selected from the best-available data that either continuously vary across space or have at least administrative level 1 (provincial/state) resolution, and which have global spatial coverage.
| Scope: | Global |
| Category: | Demographic |
| Data type: | GeoTIFF |
| Resolution: | 30 arc-second (~1 km) |
| Timepoints: | 2010 – 2020 |
| Units: | 0 to 100 |
Availability: Available to download
Licence: When authors make use of data they should cite both the data set and the scientific publication, if available. Such a practice gives credit to data set producers and advances principles of transparency and reproducibility. Please visit the data citations page (https://sedac.ciesin.columbia.edu/citations) for details. Users who would like to choose to format the citation(s) for this dataset using a myriad of alternate styles can copy the DOI number and paste it into Crosscite's website.
Reference: Center for International Earth Science Information Network - CIESIN - Columbia University. 2022. Global Gridded Relative Deprivation Index (GRDI), Version 1. Palisades, New York: NASA Socioeconomic Data and Applications Center (SEDAC). https://doi.org/10.7927/3xxe-ap97. Accessed DAY MONTH YEAR.
uP6 OECD Global Agriculture ⇑
🌐 https://www.oecd.org/content/dam/oecd/en/publications/reports/2021/07/oecd-fao-agricultural-outlook-2021-2030_31d65f37/19428846-en.pdfDescription: The projections cover agriculture markets and commodities such as cereals, oil-seeds, dairy products, cotton and more. Trade statistics include data on production and output, prices, trade balances, ending stocks, consumption, transformation, and so on.
Model / methods: See methodology section https://www.oecd-ilibrary.org/sites/19428846-en/1/4/2/index.html?itemId=/content/publication/19428846-en&_csp_=78a77099f3b0c6eae1de8bfe93d3b09e&itemIGO=oecd&itemContentType=book
| Scope: | Global |
| Category: | Agriculture/Aquaculture |
| Data type: | Comma separated values (.csv) |
| Timepoints: | 2021-2030 |
| Units: | mainly tonnes |
Availability: Download page no longer accessible
Licence: Copyrighted OECD/FAO
Reference: OECD/FAO (2021), "OECD-FAO Agricultural Outlook (Edition 2021)", OECD Agriculture Statistics (database), https://doi.org/10.1787/4bde2d83-en (accessed on 20 March 2024).
uP7 Agricultural and fishery GDP ⇑
🌐 https://datacatalog.worldbank.org/search/dataset/0061507/Global-Gridded-Description: Global high resolution gridded Agricultural GDP (corresponding to "agriculture, forestry, and fishing, value added" in World Development Indicators).
Model / methods: Data fusion method based on cross-entropy optimization. We disaggregate national and subnational administrative statistics of Agricultural GDP (circa 2010) into the global gridded dataset at using satellite-derived indicators of the components that make up agricultural GDP, namely crop, livestock, fishery, hunting and timber production
| Scope: | Global |
| Category: | Agriculture/Aquaculture |
| Data type: | Tag Image File Format (.tif) |
| Resolution: | 10x10 km |
| Timepoints: | 2010 |
| Units: | US$ per 5 arc-minute grid |
Availability: Available to download
Licence: This dataset is classified as Public under the Access to Information Classification Policy. Users inside and outside the Bank can access this dataset.
Reference: Blankespoor, B., Ru, Y., U. Wood-Sichra, T. S. Thomas, L. You and E. Kalvelagen. 2022. Estimating Local Agricultural GDP across the World, The World Bank.
uP8 Global Phosphorus Losses from Croplands under Future Precipitation Scenarios ⇑
🌐 https://doi.org/10.1021/acs.est.0c03978Description: Losses of P from croplands entrained with surface runoff and leaching water as well as soil erosion as particulate forms
Model / methods: Combine simulations of a gridded crop model and outputs from a number of hydrological and climate models to assess global impacts of changes in precipitation regimes on P losses during the 21st century. PEPIC is a grid-based version of the Environmental Policy Integrated Climate (EPIC) model to simulate crop yields, crop water use, and N dynamics at large scales
| Scope: | Global |
| Category: | Nutrients |
| Resolution: | 0.5 arc degree |
| Timepoints: | baseline 1991–2010, then projected to 2020–2039, 2040-2059, 2060–2079 and 2080-2099 |
| Units: | P losses (kg P ha–1 year–1) and Precipitation in (mm/yr) |
| RCP(s): | RCP2.6, RCP4.5, RCP6.0, and RCP8.5 |
| SSP(s): | SSP2 to estimate future populations |
Availability: Need to request permission: Permission may be obtained from ACS for other uses through requests via the RightsLink permission system: http://pubs.acs.org/page/copyright/permissions.html.
Licence: Copyright © 2020 American Chemical Society
Reference: Wenfeng Liu, Philippe Ciais, Xingcai Liu, Hong Yang, Arjen Y. Hoekstra, Qiuhong Tang, Xuhui Wang, Xiaodong Li, and Lei Cheng. Global Phosphorus Losses from Croplands under Future Precipitation Scenarios, Environmental Science & Technology 2020 54 (22), 14761-14771. DOI: 10.1021/acs.est.0c03978
uP9 Fertilizer use by crop and by country ⇑
🌐 https://doi.org/10.5061/dryad.2rbnzs7qhDescription: Fertiliser (N, P2O5 and K2O) use by crop and country
Model / methods: A first global fertilizer use by crop (FUBC) report was published in 1992 for the 1990/1991 period, based on an expert survey conducted jointly by the Food and Agriculture Organization (FAO) of the UN, the International Fertilizer Development Center (IFDC) and the International Fertilizer Association (IFA). Since then, similar expert surveys have been carried out and published every two to four years in the main fertilizer-consuming countries.
| Scope: | Global |
| Category: | Nutrients |
| Data type: | Comma separated values (.csv) |
| Timepoints: | 1992-2022 |
| Units: | Kilo (*1000) metric tonnes of P2O5 and of elemental nitrogen per year and kg P2O5/ha/year, and Percentage of total crop area that received any P2O5 fertilizer and many others (see Meta_data_FUBC_1_to_9_data) |
Availability: Available to download
Licence: CC0 1.0 (no copyright): https://creativecommons.org/publicdomain/zero/1.0/deed.en
Reference: Ludemann, Cameron; Gruere, Armelle; Heffer, Patrick; Dobermann, Achim (2022). Global data on fertilizer use by crop and by country [Dataset]. Dryad. https://doi.org/10.5061/dryad.2rbnzs7qh
uP10 Soil Plant Available Phosphorus ⇑
🌐 https://figshare.com/articles/dataset/Global_Available_Soil_Phosphorus_Database/14241854Description: The most up-to-date repository of freely available data for plant available phosphorus at a global scale. Distribution and global stock of soil Olsen phosphorus.
Model / methods: 33,000 soil samples of soil Olsen phosphorus concentrations. Model (R2 = 0.54) of topsoil Olsen phosphorus concentrations that when combined with data on bulk density predicted the distribution and global stock of soil Olsen phosphorus.
| Scope: | Global |
| Category: | Nutrients |
| Data type: | Comma separated values (.csv), Excel (.xlsx) and Tag Image File Format (.tiff) |
| Resolution: | 1km2 |
| Timepoints: | 2000-2019 |
| Units: | Olsen P (mg/kg) |
Availability: Available to download
Licence: Creative Commons Attribution 4.0 International License
Reference: McDowell, R. W., Pletnyakov, P., Noble, A. & Haygarth, P. M. A Global Database of Soil Plant Available Phosphorus. figshare https://doi.org/10.6084/m9.figshare.14241854 (2023)
uP11 Land-side aquaculture Ponds Distribution ⇑
🌐 https://doi.org/10.1016/j.jag.2022.103100Description: Global distribution pattern of aquaculture ponds
Model / methods: Acquired from 10-m Sentinel-2 time-series images from Google Earth Engine
| Scope: | Global |
| Category: | Agriculture/Aquaculture |
| Data type: | shapefile (.shp) |
| Resolution: | 1 degree |
| Timepoints: | 2020 |
| Units: | km2 |

Availability: Need to request
Licence: CC BY 4.0 DEED
Reference: Zhihua Wang, Junyao Zhang, Xiaomei Yang, Chong Huang, Fenzhen Su, Xiaoliang Liu, Yueming Liu, Yuanzhi Zhang. Global mapping of the landside clustering of aquaculture ponds from dense time-series 10 m Sentinel-2 images on Google Earth Engine, International Journal of Applied Earth Observation and Geoinformation, Volume 115, 2022, 103100, https://doi.org/10.1016/j.jag.2022.103100.
uP12 Patterns and drivers of soil total phosphorus concentration ⇑
🌐 https://figshare.com/articles/figure/Global_patterns_and_drivers_of_soil_total_phosphorus_concentration/14583375Description: Soil total P concentration by parent material types, soil orders, biomes, and continents. Global map of soil total P concentration and underlying drivers of soil total P concentration
Model / methods: Database of total P concentration of 5275 globally distributed (semi-)natural soils from 761 published studies. We quantified the relative importance of 13 soil-forming variables in predicting soil total P concentration and then made further predictions at the global scale using a random forest approach.
| Scope: | Global |
| Category: | Nutrients |
| Data type: | Comma separated values (.csv), and Tag Image File Format (.tiff) |
| Resolution: | 0.5-degree |
| Units: | Soil total P concentration in mg kg−1 and Soil P stocks in Pg |
Availability: Available to download
Licence: Creative Commons Attribution 4.0 License.
Reference: He, X., Augusto, L., Goll, D. S., Ringeval, B., Wang, Y., Helfenstein, J., Huang, Y., Yu, K., Wang, Z., Yang, Y., and Hou, E.: Global patterns and drivers of soil total phosphorus concentration, Earth Syst. Sci. Data, 13, 5831–5846, https://doi.org/10.5194/essd-13-5831-2021, 2021.
uP13 Phosphorus in agricultural soils ⇑
🌐 https://entrepot.recherche.data.gouv.fr/dataset.xhtml?persistentId=doi:10.57745/XZTW7ZDescription: Agricultural soil phosphorus (P) pools, fluxes of P corresponding to soil P input/output and to soil P dynamics. For cropland and grassland, representative to the top soil layer 0-0.3m
Model / methods: Modelling approach combined several global datasets describing the drivers of agricultural soil P with a soil P dynamics model to simulate the temporal evolution of the agricultural soil P from the beginning of the 20th century to the present time period. Full methodology described in related publication.
| Scope: | Global |
| Category: | Nutrients |
| Data type: | NetCDF (.nc) |
| Resolution: | 0.5 degree |
| Timepoints: | 1900-2018 |
| Units: | fluxes in kgP/ha/yr and pools in kgP/ha |
Availability: Available to download
Licence: Our Community Norms (https://dataverse.org/best-practices/dataverse-community-norms) as well as good scientific practices expect that proper credit is given via citation. Please use the data citation shown on the dataset page. This work is licensed under a Creative Commons Attribution-NonCommercial-ShareAlike 4.0 International License https://creativecommons.org/licenses/by-nc-sa/4.0/
Reference: Related publication: Ringeval, B., Demay, J., Goll, D.S. et al. A global dataset on phosphorus in agricultural soils. Sci Data 11, 17 (2024). https://doi.org/10.1038/s41597-023-02751-6 Data reference: RINGEVAL, Bruno, 2023, "GPASOIL-v1, a global dataset on phosphorus in agricultural soils", https://doi.org/10.57745/XZTW7Z, Recherche Data Gouv, V1
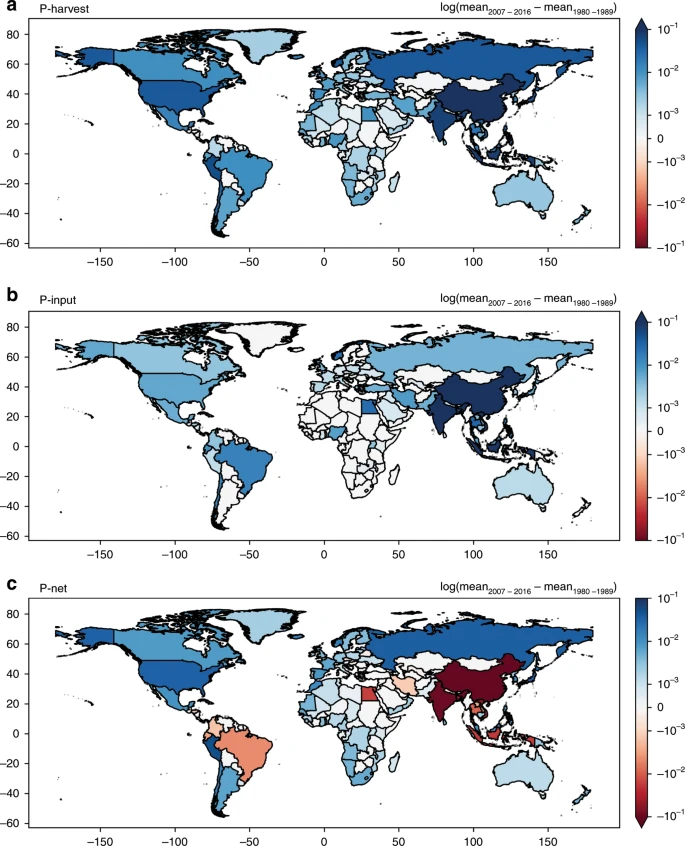
uP14 Phosphorus transfers in global fisheries and aquaculture ⇑
🌐 https://doi.org/10.1038/s41467-019-14242-7Description: P-harvest, P-input, and P-net from fisheries and aquaculture
Model / methods: World fishery production (1950–2016) is obtained by combining two databases, the Food and Agriculture Organization of the United Nations (FAO) Global Fishery Production database, FishStatJ version 3.04.625 and the reconstructed wild marine fish capture database from Sea Around Us (http://www.seaaroundus.org/).
| Scope: | Global |
| Category: | Agriculture/Aquaculture |
| Data type: | Excel (.xlsx) |
| Resolution: | by country (TM World Borders Dataset 0.3.) |
| Timepoints: | 1950-2016 |
| Units: | Tg P per year |
Availability: Available to download
Licence: Creative Commons Attribution 4.0
Reference: Huang, Y., Ciais, P., Goll, D.S. et al. The shift of phosphorus transfers in global fisheries and aquaculture. Nat Commun 11, 355 (2020). https://doi.org/10.1038/s41467-019-14242-7
uP15 Future climate projections (CMIP6) ⇑
🌐 https://aims2.llnl.gov/searchDescription: Monthly values of minimum temperature, maximum temperature, and precipitation were processed for 23 global climate models (GCMs), and for four Shared Socio-economic Pathways (SSPs): 126, 245, 370 and 585.
Model / methods: Downscaling: Global climate models GCMs. See https://www.worldclim.org/data/downscaling.html
| Scope: | Global |
| Category: | Climate |
| Data type: | NetCDF (.nc) |
| Resolution: | 10 minutes, 5 minutes, 2.5 minutes, and 30 seconds. |
| Timepoints: | The monthly values were averages over 20 year periods (2021-2040, 241-2060, 2061-2080, 2081-2100). |
| Units: | temperature (°C), precipitation (mm) |
| SSP(s): | 126, 245, 370 and 585 |
Availability: Available to download
Licence: Creative Commons Attribution-ShareAlike 4.0 International License (https://creativecommons.org/licenses/) but Must see Terms of Use https://pcmdi.llnl.gov/CMIP6/TermsOfUse/TermsOfUse6-1.html
Reference: cite authors of specific models used, see https://pcmdi.llnl.gov/CMIP6/TermsOfUse/TermsOfUse6-1.html
uP16 Historical climate data (WorldClim version 2.1) ⇑
🌐 https://www.worldclim.org/data/worldclim21.html#google_vignetteDescription: Monthly climate data for minimum, mean, and maximum temperature, precipitation, solar radiation, wind speed, water vapor pressure, and for total precipitation.
Model / methods: Climate data sources used included databases with long-term average values, time-series of monthly averages by year and daily weather data. See methods: https://rmets.onlinelibrary.wiley.com/doi/full/10.1002/joc.5086
| Scope: | Global |
| Category: | Climate |
| Data type: | GeoTiff (.tif) |
| Resolution: | 10 minutes, 5 minutes, 2.5 minutes, and 30 seconds. |
| Timepoints: | 1970-2000 |
| Units: | temperature (°C), precipitation (mm), solar radiation (kJ m-2 day-1), |
Availability: Available to download
Reference: Fick, S.E. and R.J. Hijmans, 2017. WorldClim 2: new 1km spatial resolution climate surfaces for global land areas. International Journal of Climatology 37 (12): 4302-4315.
uP17 Soil Phosphorus Distribution ⇑
🌐 https://doi.org/10.3334/ORNLDAAC/1223Description: Estimates of different forms of naturally occurring soil phosphorus (P) including labile inorganic P, organic P, occluded P, secondary mineral P, apatite P, and total P on a global scale at 0.5-degree resolution
Model / methods: The data were assembled from chronosequence information and global spatial databases
| Scope: | Global |
| Category: | Nutrients |
| Data type: | NetCDF (.nc) |
| Resolution: | 0.5-degree |
| Units: | total P (gP/m2) |
Availability: Must sign in to download
Licence: This dataset is openly shared, without restriction, in accordance with the EOSDIS Data Use Policy (https://www.earthdata.nasa.gov/learn/use-data/data-use-policy?_ga=2.24275642.1889385269.1711450055-80422866.1711450055&_gl=1%2A1bojqcd%2A_ga%2AODA0MjI4NjYuMTcxMTQ1MDA1NQ..%2A_ga_LQ2P0SNJCZ%2AMTcxMTQ1MDA1NS4xLjEuMTcxMTQ1MDA5MS4wLjAuMA..). See our Data Use and Citation Policy for more information.
Reference: Yang, X., W.M. Post, P.E. Thornton, and A.K. Jain. 2014. Global Gridded Soil Phosphorus Distribution Maps at 0.5-degree Resolution. ORNL DAAC, Oak Ridge, Tennessee, USA. https://doi.org/10.3334/ORNLDAAC/1223
uP18 HydroBASINS ⇑
🌐 https://www.hydrosheds.org/products/hydrobasinsDescription: Vectorized polygon layers that depict sub-basin boundaries at a global scale
Model / methods: HydroBASINS has been extracted from the gridded HydroSHEDS core layers at 15 arc-second resolution.
| Scope: | Global |
| Category: | Catchments |
| Data type: | shapefile (.shp) |
| Resolution: | from tens to millions of square kilometers |
| Units: | km2 |

Availability: Freely available for scientific, educational and commercial use.
Licence: The HydroBASINS database is freely available for scientific, educational and commercial use. The data are distributed under the same license agreement as the HydroSHEDS core products, which is included in the Technical Documentation (https://data.hydrosheds.org/file/technical-documentation/HydroSHEDS_TechDoc_v1_4.pdf). For all regulations regarding license grants, copyright, redistribution restrictions, required attributions, disclaimer of warranty, indemnification, liability, and waiver of damages, please refer to the license agreement. By downloading and using the data the user agrees to the terms and conditions of this license.
Reference: Lehner, B., Grill G. (2013). Global river hydrography and network routing: baseline data and new approaches to study the world’s large river systems. Hydrological Processes, 27(15): 2171–2186. https://doi.org/10.1002/hyp.9740
uP19 HydroLAKES ⇑
🌐 https://www.hydrosheds.org/products/hydrolakesDescription: Shoreline polygons of all global lakes with a surface area of at least 10 ha and pour points
Model / methods: Developed using a suite of auxiliary data sources of lake polygons and gridded lake surface areas. HydroLAKES only includes a limited amount of (mostly geometric) attribute information, such as surface area, shoreline length, and estimates of average depth, water volume and residence time.
| Scope: | Global |
| Category: | Catchments |
| Data type: | shapefile (.shp) and geodatabase |
| Resolution: | The resulting map scale is estimated to be about 1:100,000 for Canada and Alaska (i.e., accounting for two thirds of global lake numbers); about 1:250,000 for Europe and all areas below 60 degrees northern latitude (i.e., accounting for most of the global landmass); and about 1:1 million for the remaining areas (i.e., northern Russia and Greenland). |
| Units: | km2 |
Availability: Available to download
Licence: Creative Commons Attribution-ShareAlike 4.0 International License
Reference: Messager, M.L., Lehner, B., Grill, G., Nedeva, I., Schmitt, O. (2016). Estimating the volume and age of water stored in global lakes using a geo-statistical approach. Nature Communications, 7: 13603. https://doi.org/10.1038/ncomms13603
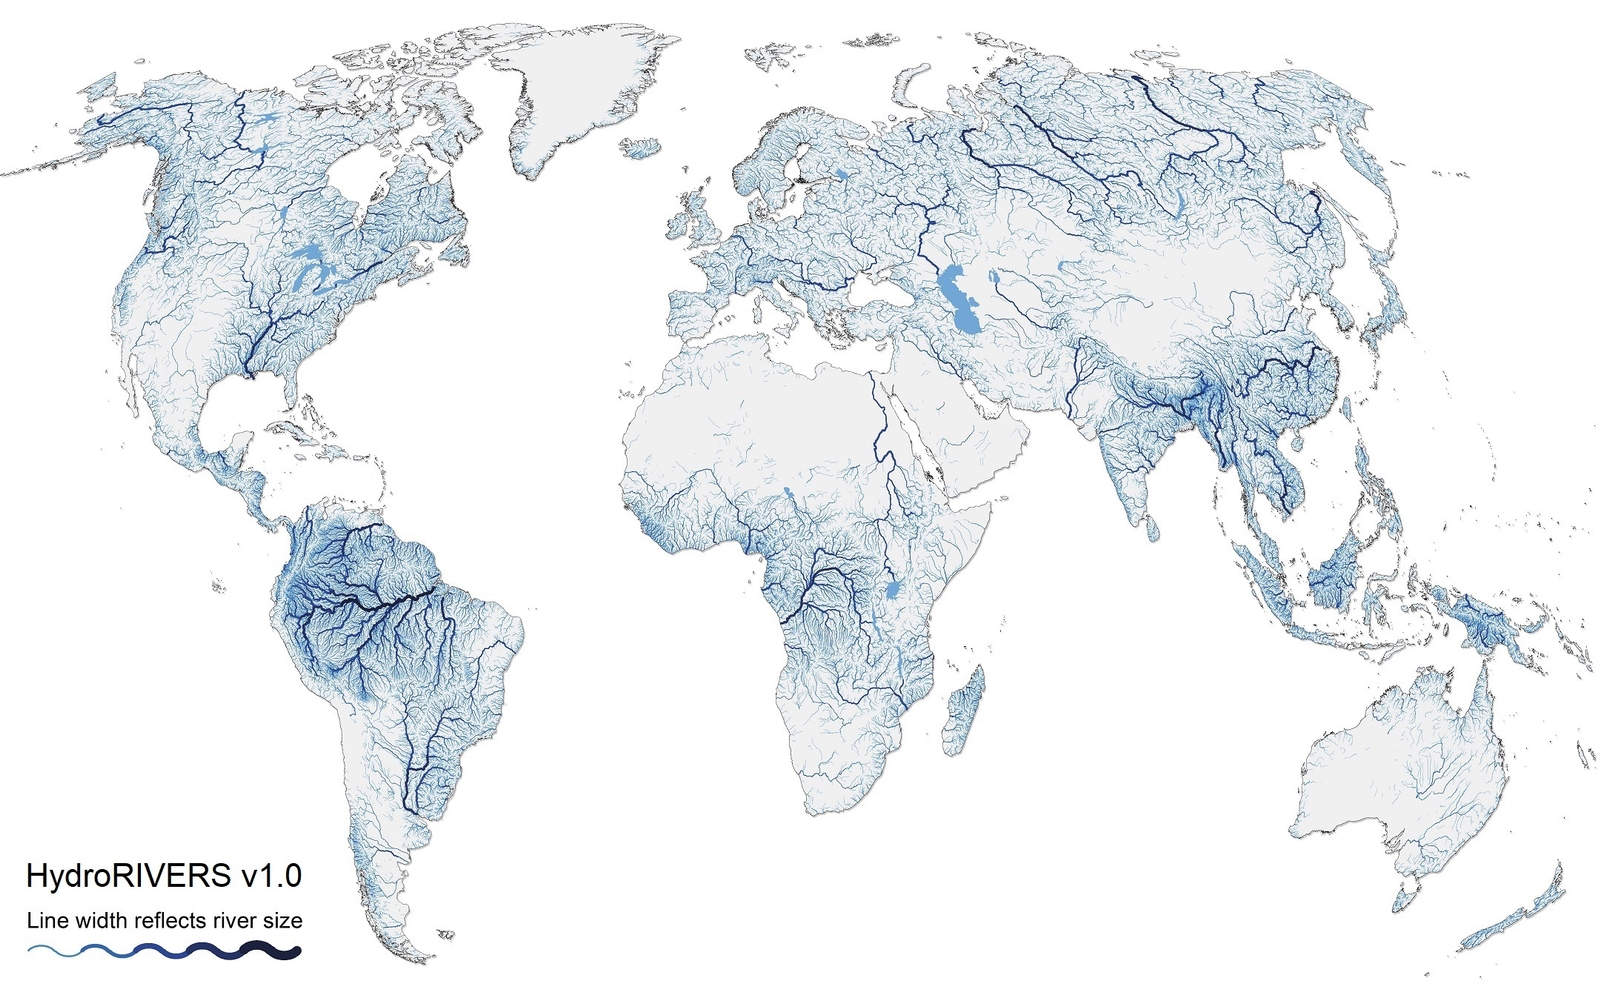
uP20 HydroRIVERS ⇑
🌐 https://www.hydrosheds.org/products/hydroriversDescription: Vectorized line network of all global rivers that have a catchment area of at least 10 km² or an average river flow of at least 0.1 m³/sec, or both.
Model / methods: Extracted from the gridded HydroSHEDS core layers at 15 arc-second resolution. HydroRIVERS only includes a limited amount of (mostly geometric) attribute information, such as the river reach length, the distance from upstream headwaters and ocean outlet, the river order, and an estimate of long-term average discharge.
| Scope: | Global |
| Category: | Catchments |
| Data type: | shapefile (.shp) and geodatabase |
| Units: | km |
Availability: Available to download
Licence: freely available for scientific, educational and commercial use. The data are distributed under the same license agreement as the HydroSHEDS core products, which is included in the Technical Documentation (https://data.hydrosheds.org/file/technical-documentation/HydroSHEDS_TechDoc_v1_4.pdf).
Reference: Lehner, B., Grill G. (2013). Global river hydrography and network routing: baseline data and new approaches to study the world’s large river systems. Hydrological Processes, 27(15): 2171–2186. https://doi.org/10.1002/hyp.9740
uP21 Elevation ⇑
🌐 https://www.worldclim.org/data/worldclim21.html#google_vignetteDescription: Elevation (WorldClim 2)
Model / methods: from https://lta.cr.usgs.gov/GTOPO30 and http://srtm.csi.cgiar.org/
| Scope: | Global |
| Category: | Catchments |
| Data type: | GeoTiff (.tif) |
| Resolution: | 10 minutes, 5 minutes, 2.5 minutes, and 30 seconds. |
| Units: | m |
Availability: Available to download
Reference: Fick, S.E. and R.J. Hijmans, 2017. WorldClim 2: new 1km spatial resolution climate surfaces for global land areas. International Journal of Climatology 37 (12): 4302-4315.
uP22 MARINA-Multi - Pollution due to livestock production ⇑
🌐 https://www.wur.nl/en/research-results/chair-groups/environmental-sciences/earth-systems-and-global-change-group/research-3/water-quality/the-marina-models/multiple-pollutants/pollution-due-to-livestock-production.htmDescription: Annual inputs of nitrogen, phosphorus and Cryptosporidium to rivers by source and sub-basin. Sources: diffuse sources (manure application on land) and point sources (direct discharges of manure to rivers) from livestock production.
Model / methods: Marina-Multi, Version 2.0 (Model to Assess Inputs of pollutaNts to seAs). The MARINA-Multi models focus on multiple pollutants in water systems by combining nutrient, plastic, antibiotic and other pollutants. The models aim to quantify inputs of these multiple pollutants to rivers and their river exports by sources for the past, present and future.
| Scope: | Global |
| Category: | Nutrients |
| Resolution: | sub-basin |
| Timepoints: | 2010-2100 |
| Units: | kg/km2/yr |
Availability: Need to request
Licence: CC BY 4.0 DEED (https://creativecommons.org/licenses/by/4.0/)
Reference: Yanan Li, Mengru Wang, Xuanjing Chen, Shilei Cui, Nynke Hofstra, Carolien Kroeze, Lin Ma, Wen Xu, Qi Zhang, Fusuo Zhang, Maryna Strokal. Multi-pollutant assessment of river pollution from livestock production worldwide, Water Research, Volume 209, 2022, 117906, ISSN 0043-1354, https://doi.org/10.1016/j.watres.2021.117906.
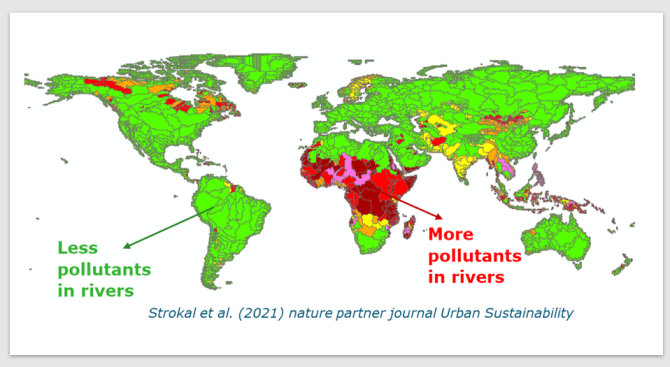
uP23 MARINA-Multi - Pollution due to urbanization ⇑
🌐 https://www.wur.nl/en/research-results/chair-groups/environmental-sciences/earth-systems-and-global-change-group/research-3/water-quality/the-marina-models/multiple-pollutants/pollution-due-to-urbanization.htmDescription: Annual inputs of nitrogen, phosphorus, microplastics, triclosan and Cryptosporidium to rivers in 10226 sub-basins in the world. Sources: point (sewage and open defecation),
Model / methods: MARINA-Multi Model Version 1.0 (Model to Assess Inputs of pollutaNts to seAs). The MARINA-Multi models focus on multiple pollutants in water systems by combining nutrient, plastic, antibiotic and other pollutants. The models aim to quantify inputs of these multiple pollutants to rivers and their river exports by sources for the past, present and future. See Supplementary information https://static-content.springer.com/esm/art%3A10.1038%2Fs42949-021-00026-w/MediaObjects/42949_2021_26_MOESM1_ESM.pdf.
| Scope: | Global |
| Category: | Nutrients |
| Data type: | R files (.R) and Excel (.xlsx) |
| Resolution: | 0.5 degree |
| Timepoints: | 2010, 2050 and 2100 |
| Units: | N (kg km−2 year−1), P (kg km−2 year−1), triclosan (g km−2 year−1), microplastics ( kg km−2 year−1) |
| SSP(s): | SSP3, SSP2, SSP4, SSP5, SSP1 |
Availability: All the datasets generated and analysed during this study are publicly available in the Data Archiving and Networked Services (DANS Easy) repository: https://doi.org/10.17026/dans-zyx-jce3 The data will be available for download from 01–04–2021. The data supporting the findings of this study are described in the following metadata record: https://doi.org/10.6084/m9.figshare.13333796
Licence: CC BY NC ND (http://creativecommons.org/licenses/by/4.0/): Open Access This article is licensed under a Creative Commons Attribution 4.0 International License, which permits use, sharing, adaptation, distribution and reproduction in any medium or format, as long as you give appropriate credit to the original author(s) and the source, provide a link to the Creative Commons license, and indicate if changes were made. The images or other third party material in this article are included in the article’s Creative Commons license, unless indicated otherwise in a credit line to the material. If material is not included in the article’s Creative Commons license and your intended use is not permitted by statutory regulation or exceeds the permitted use, you will need to obtain permission directly from the copyright holder.
Reference: Strokal, M., Bai, Z., Franssen, W. et al. Urbanization: an increasing source of multiple pollutants to rivers in the 21st century. npj Urban Sustain 1, 24 (2021). https://doi.org/10.1038/s42949-021-00026-w
uP24 MARINA-Multi - Pollution due to urbanization and agriculture ⇑
🌐 https://www.wur.nl/en/research-results/chair-groups/environmental-sciences/earth-systems-and-global-change-group/research-3/water-quality/the-marina-models/multiple-pollutants/pollution-due-to-urbanization-and-agriculture.htmDescription: Annual inputs of nitrogen, phosphorus, triclosan, microplastics, macroplastics and diclofenac. Sources: diffuse sources (agricultural runoff) and point sources (sewage systems, open defecation, direct discharges of manure)
Model / methods: MARINA-Multi Global-4.0. The MARINA-Multi models focus on multiple pollutants in water systems by combining nutrient, plastic, antibiotic and other pollutants. The models aim to quantify inputs of these multiple pollutants to rivers and their river exports by sources for the past, present and future. Sources: diffuse sources (agricultural runoff) and point sources (sewage systems, open defecation, direct discharges of manure)
| Scope: | Global |
| Category: | Nutrients |
| Resolution: | sub-basin |
| Timepoints: | 2010-2100 |
Availability: Under development
Licence: Under development
Reference: Still under development by Ilaria Micella PhD candidate (https://www.wur.nl/en/project/Innovative-forecasting-approaches-to-assess-future-trends-in-pollutant-flows-from-land-to-water-systems-for-advancing-sectoral-water-quality-service.htm)
uP25 MARINA-Nutrients - Nutrients (N and P) from sub-basins ⇑
🌐 https://www.wur.nl/en/research-results/chair-groups/environmental-sciences/earth-systems-and-global-change-group/research-3/water-quality/the-marina-models/nutrients/global-change-impacts.htmDescription: Annual river export of nutrients (dissolved inorganic and organic nitrogen and phosphorus) from sub-basins globally. Sources: point (sewage) and diffuse (agriculture, natural areas).
Model / methods: MARINA-Nutrients Global Version 2.0 (Model to Assess Inputs of pollutaNts to seAs)
| Scope: | Global |
| Category: | Nutrients |
| Data type: | Comma separated values (.csv) and shapefiles (.shp) |
| Resolution: | sub-basin |
| Timepoints: | 2010 and 2050 |
| Units: | kg/km2 of sub-basin/year |
| RCP(s): | RCP2.6, RCP8.5 |
| SSP(s): | SSP1 and SSP5 |
Availability: Protected, users will have to email the author to download the data
Licence: CC-BY-NC-ND-4.0 (http://creativecommons.org/licenses/by-nc-nd/4.0) and INMS Data Licence (Point source data are published with licence: Strokal, Maryna; Bai, Zhaohai; Franssen, Wietse; Hofstra, Nynke; Koelmans, Albert A.; Ludwig, Fulco; et al. Metadata supporting the article: Urbanization: an increasing source of multiple pollutants to rivers in the 21st century. https://doi.org/10.6084/m9.figshare.13333796 (2020) )
Reference: Seems still under development - Strokal, M., Bai, Z., Franssen, W. et al. Urbanization: an increasing source of multiple pollutants to rivers in the 21st century. npj Urban Sustain 1, 24 (2021). https://doi.org/10.1038/s42949-021-00026-w Wang, M., Kroeze, C., Strokal, M., vanVliet, M. T. H., & Ma, L. (2020). Global change can make coastal eutrophication control in China more difficult. Earth's Future, 8, e2019EF001280. https://doi.org/10.1029/2019EF001280
uP26 SGD Water Quality Hub ⇑
🌐 https://sdg632hub.org/Description: Dissolved oxygen, electrical conductivity, total nitrogen, Total Oxidized Nitrogen/Nitrate and Nitrite Nitrogen, total phosphorus, Total Reactive Phosphorus/Total Orthophosphate, ph of water bodies by country
Model / methods: Portal designed for those tasked with reporting on SDG indicator 6.3.2 (tracks progress towards SDG target 6.3. This target aims to improve water quality of rivers, lakes and aquifers globally) for their country. It streamlines the reporting process, provides real-time feedback and insight into submissions, as well as information on the supports available.
| Scope: | Global |
| Category: | Catchments |
| Resolution: | country |
| Timepoints: | 2017, 2020, 2023 |
| Units: | Dissolved oxygen (% saturation), electrical conductivity (us/cm), total nitrogen (ug{N}/L), Total Oxidized Nitrogen/Nitrate and Nitrite Nitrogen (ug{N}/L), total phosphorus (ug{P}/L), Total Reactive Phosphorus/Total Orthophosphate (ug{P}/L), ph |

Availability: Need an invite to be able to login
Reference: UN Development Programme SDG water quality hub (The Global Environment Monitoring System for Freshwater)
uP27 Aqueduct Water Risk Atlas ⇑
🌐 https://www.wri.org/applications/aqueduct/water-risk-atlas/Description: Water risk (e.g. water stress, depletion, drought risk) for present and future scenarios, global data. 13 indicators representing baseline annual water risks. 3 indicators representing baseline monthly water risks. 6 indicators representing future projections of annual water risks.
Model / methods: Aqueduct™ 4.0, the latest iteration of WRI’s water risk framework designed to translate complex hydrological data into intuitive indicators of water-related risk.
| Scope: | Global |
| Category: | Catchments |
| Resolution: | FAO basins |
| Timepoints: | Baseline, and future 2030, 2050, 2080 |
| RCP(s): | RCP2.6, RCP 7.0, RCP 8.5 |
| SSP(s): | SSP1, SSP3, SSP5 |
Availability: Need login, request download from here: https://www.wri.org/data/aqueduct-global-maps-40-data#download-form
Reference: Download publication from here: https://www.wri.org/data/aqueduct-global-maps-40-data#download-form but must create login
uP28 BasinATLAS (HydroATLAS) ⇑
🌐 https://www.hydrosheds.org/hydroatlasDescription: BasinATLAS provides sub-basin characteristics for hierarchically nested watersheds at twelve spatial scales. The geospatial units for BasinATLAS , i.e., sub-basin polygons have been derived from the global hydrographic database HydroSHEDS
Model / methods: HydroATLAS derives these hydro-environmental attributes by reformatting original data from well established global digital maps. All spatial units of BasinATLAS and RiverATLAS, i.e., either sub-basin polygons or river reach lines, were extracted from World Wildlife Fund’s HydroSHEDS database (Lehner et al. 2008; Lehner and Grill 2013) at a grid resolution of 15 arc-seconds (approx. 500 m at the equator). For more information on HydroSHEDS please refer to the Technical Documentation at http://www.hydrosheds.org
| Scope: | Global |
| Category: | Catchments |
| Data type: | polygons (ESRI geodatabase or shapefile) |
| Resolution: | 15 arc-second (~500 m) |

Availability: Available to download
Licence: GENERAL LICENSE: HydroATLAS forms a Collective Database, i.e., a collection of information from independent datasets, and as a whole is licensed under a Creative Commons Attribution 4.0 International License (CC-BY 4.0; http://creativecommons.org/licenses/by/4.0/). However, the individual parts (content) of this Collective Database are still governed by their own licenses. In version 1.0 of HydroATLAS, all attribute columns are licensed under either a Creative Commons Attribution 4.0 International License (CC-BY 4.0) or an Open Data Commons Open Database License (ODbL 1.0; https://opendatacommons.org/licenses/odbl/1-0/index.html), both permitting reuse of the data for any purpose including commercial. In cases where original licenses differ from CC-BY 4.0 or ODbL 1.0, special permission was obtained from the original author(s) to release their works in the format of HydroATLAS under a CC-BY 4.0 or ODbL 1.0 license. Note that the licenses of the underpinning source datasets in their original format are not affected or altered by these licenses. Detailed information regarding the specific license that applies to each attribute column is provided in the respective data sheet of the BasinATLAS, RiverATLAS and LakeATLAS catalogs
Reference: Linke, S., Lehner, B., Ouellet Dallaire, C., Ariwi, J., Grill, G., Anand, M., Beames, P., Burchard-Levine, V., Maxwell, S., Moidu, H., Tan, F., Thieme, M. (2019). Global hydro-environmental sub-basin and river reach characteristics at high spatial resolution. Scientific Data 6: 283. https://doi.org/10.1038/s41597-019-0300-6
uP29 RiverATLAS (HydroATLAS) ⇑
🌐 https://www.hydrosheds.org/hydroatlasDescription: RiverATLAS contains characteristics for hierarchically nested watersheds at twelve spatial scales yet calculated for river and stream reaches rather than sub-basins. The geospatial units for RiverATLAS i.e.river reach line segments have been derived from the global hydrographic database HydroSHEDS
Model / methods: HydroATLAS derives these hydro-environmental attributes by reformatting original data from well established global digital maps. All spatial units of BasinATLAS and RiverATLAS, i.e., either sub-basin polygons or river reach lines, were extracted from World Wildlife Fund’s HydroSHEDS database (Lehner et al. 2008; Lehner and Grill 2013) at a grid resolution of 15 arc-seconds (approx. 500 m at the equator). For more information on HydroSHEDS please refer to the Technical Documentation at http://www.hydrosheds.org
| Scope: | Global |
| Category: | Catchments |
| Data type: | line segments (ESRI geodatabase or shapefile) |
| Resolution: | 15 arc-second (~500 m) |
Availability: Available to download
Licence: GENERAL LICENSE: HydroATLAS forms a Collective Database, i.e., a collection of information from independent datasets, and as a whole is licensed under a Creative Commons Attribution 4.0 International License (CC-BY 4.0; http://creativecommons.org/licenses/by/4.0/). However, the individual parts (content) of this Collective Database are still governed by their own licenses. In version 1.0 of HydroATLAS, all attribute columns are licensed under either a Creative Commons Attribution 4.0 International License (CC-BY 4.0) or an Open Data Commons Open Database License (ODbL 1.0; https://opendatacommons.org/licenses/odbl/1-0/index.html), both permitting reuse of the data for any purpose including commercial. In cases where original licenses differ from CC-BY 4.0 or ODbL 1.0, special permission was obtained from the original author(s) to release their works in the format of HydroATLAS under a CC-BY 4.0 or ODbL 1.0 license. Note that the licenses of the underpinning source datasets in their original format are not affected or altered by these licenses. Detailed information regarding the specific license that applies to each attribute column is provided in the respective data sheet of the BasinATLAS, RiverATLAS and LakeATLAS catalogs
Reference: Linke, S., Lehner, B., Ouellet Dallaire, C., Ariwi, J., Grill, G., Anand, M., Beames, P., Burchard-Levine, V., Maxwell, S., Moidu, H., Tan, F., Thieme, M. (2019). Global hydro-environmental sub-basin and river reach characteristics at high spatial resolution. Scientific Data 6: 283. https://doi.org/10.1038/s41597-019-0300-6
uP30 LakeATLAS (HydroATLAS) ⇑
🌐 https://www.hydrosheds.org/hydroatlasDescription: LakeATLAS contains characteristics for hierarchically nested watersheds at twelve spatial scales yet calculated for lake polygons. Its geospatial units are provided by the HydroLAKES database (Messager et al. 2016) and are linked to the sub-basins and river reaches of HydroSHEDS via corresponding IDs.
Model / methods: HydroATLAS derives these hydro-environmental attributes by reformatting original data from well established global digital maps. All spatial units of LakeATLAS, i.e., the polygons of all lakes in the world with at least 10 ha in surface area, were provided by the HydroLAKES database (Messager et al. 2016). For more information on HydroLAKES please refer to the Technical Documentation at https://www.hydrosheds.org/hydrolakes.
| Scope: | Global |
| Category: | Catchments |
| Data type: | polygons (ESRI geodatabase or shapefile) |
| Resolution: | 15 arc-second (~500 m) |
Availability: Available to download
Licence: GENERAL LICENSE: HydroATLAS forms a Collective Database, i.e., a collection of information from independent datasets, and as a whole is licensed under a Creative Commons Attribution 4.0 International License (CC-BY 4.0; http://creativecommons.org/licenses/by/4.0/). However, the individual parts (content) of this Collective Database are still governed by their own licenses. In version 1.0 of HydroATLAS, all attribute columns are licensed under either a Creative Commons Attribution 4.0 International License (CC-BY 4.0) or an Open Data Commons Open Database License (ODbL 1.0; https://opendatacommons.org/licenses/odbl/1-0/index.html), both permitting reuse of the data for any purpose including commercial. In cases where original licenses differ from CC-BY 4.0 or ODbL 1.0, special permission was obtained from the original author(s) to release their works in the format of HydroATLAS under a CC-BY 4.0 or ODbL 1.0 license. Note that the licenses of the underpinning source datasets in their original format are not affected or altered by these licenses. Detailed information regarding the specific license that applies to each attribute column is provided in the respective data sheet of the BasinATLAS, RiverATLAS and LakeATLAS catalogs
Reference: Lehner, B., Messager, M.L., Korver, M.C., Linke, S. (2022). Global hydro-environmental lake characteristics at high spatial resolution. Scientific Data 9: 351. https://doi.org/10.1038/s41597-022-01425-z
uP31 HydroSHEDS v2 (under development) ⇑
🌐 https://www.hydrosheds.org/hydrosheds-v2Description: Refined global river network and catchment delineations
Model / methods: We are currently developing HydroSHEDS v2 using 12m resolution TanDEM-X (TerraSAR-X add-on for Digital Elevation Measurement) data with full global coverage. HydroSHEDS v2 improves upon the quality and limitations of HydroSHEDS v1. In particular, coverage above 60° northern latitude (i.e., largely the Arctic) is missing for the 3 arc-second HydroSHEDS v1 product and is of low quality for coarser products because no SRTM elevation data are available for this region. Also, some areas are affected by inherent data gaps or other errors that could not be fully resolved at the time of creating version 1 of HydroSHEDS.
| Scope: | Global |
| Category: | Catchments |
| Resolution: | 3 arc second |
Availability: under development
Reference: under development
uP32 GEMSTAT data portal ⇑
🌐 https://gemstat.org/data-gemstat/data-portal/Description: GEMStat hosts water quality data of ground and surface waters providing a global overview of the condition of water bodies and the trends at global, regional and local levels. Many parameters including nutrients (P and N).
Model / methods: Countries and organisations voluntarily provide water quality data from their own monitoring networks.
| Scope: | Global |
| Category: | Catchments |
| Resolution: | stations countries and catchments |
| Timepoints: | 1906-2024 |
| Units: | See GEMStat Catalogue: https://gemstat.org/data-gemstat/data-portal/custom-data-request/ |

Availability: Need to request download, email gwdc@bafg.de
Licence: Users do not obtain title to the intellectual property of the data provided by GEMStat, nor any copyright or propriety rights to its content. Must sign declaration of data user: https://gemstat.org/2019-07/wp-content/uploads/2018/10/user_declaration.pdf
Reference: United Nations Environment Programme (2017). GEMStat database of the Global Environment Monitoring System for freshwater (GEMS/Water) Programme. International Centre for Water Resources and Global Change, Koblenz. Accessed DD MONTH YYYY. Available upon request from GEMS/Water Data Centre: gemstat.org
uP34 Global Lakes and Wetlands Database (GLWD) ⇑
🌐 https://www.worldwildlife.org/pages/global-lakes-and-wetlands-databaseDescription: Database which focuses in three coordinated levels on (1) large lakes and reservoirs, (2) smaller water bodies, and (3) wetlands. Level 1 (GLWD-1) comprises the 3067 largest lakes (area ≥ 50 km2) and 654 largest reservoirs (storage capacity ≥ 0.5 km3) worldwide. Level 2 (GLWD-2) comprises permanent open water bodies with a surface area ≥ 0.1 km2 excluding the water bodies contained in GLWD-1. Level 3 (GLWD-3) comprises lakes, reservoirs, rivers and different wetland types in the form of a global raster map at 30-second resolution.
Model / methods: Drawing upon a variety of existing maps, data and information, as detailed in the data documentation (which downloads with the data). References of main data sources applied to generate GLWD - Birkett, C.M., Mason, I.M. (1995): A new global lakes database for a remote sensing program studying climatically sensitive large lakes. Journal of Great Lakes Research 21(3): 307-318. - ESRI (Environmental Systems Research Institute) (1992): ArcWorld 1:3 Mio. Continental Coverage. Redlands, CA. Data obtained on CD. - ESRI (Environmental Systems Research Institute) (1993): Digital Chart of the World 1:1 Mio. Redlands, CA. Data obtained on 4 CDs (also available online at http://www.maproom.psu.edu/dcw/). - ICOLD (International Commission on Large Dams) (1998): Word Register of Dams. 1998 book and CD-ROM. ICOLD, Paris. - Loveland, T.R., Reed, B.C., Brown, J.F., Ohlen, D.O., Zhu, J, Yang, L., and Merchant, J.W. (2000): Development of a global land cover characteristics database and IGBP DISCover from 1-km AVHRR data. International - Journal of Remote Sensing 21(6/7): 1303–1330 (available online at http://edcdaac.usgs.gov/glcc/glcc.html). - Vörösmarty, C.J., Sharma, K.P., Fekete, B.M., Copeland, A.H., Holden, J., Marble, J., Lough, J.A. (1997): The storage and aging of continental runoff in large reservoir systems of the world. Ambio 26(4): 210-219. - WCMC (World Conservation Monitoring Centre) (1993): Digital wetlands data set. Cambridge, UK. Data obtained from WCMC in 1999.
| Scope: | Global |
| Category: | Catchments |
| Data type: | ArcView Polygon Shapefile (.shp) |
| Resolution: | 1:1 to 1:3 million resolution |
| Units: | surface area in km2, perimeter in km, mean elevation in m, mean inflow into lake in m3/s, reservoir volume in km3 and more (see individual datasets documentation) |
Availability: The data is available for free download (for non-commercial scientific, conservation and educational purposes).
Reference: Lehner, B. and Döll, P. (2004): Development and validation of a global database of lakes, reservoirs and wetlands. Journal of Hydrology 296/1-4: 1-22.
uP35 GLO-30 Digital Elevation Model ⇑
🌐 https://portal.opentopography.org/raster?opentopoID=OTSDEM.032021.4326.3Description: The Copernicus DEM is a Digital Surface Model (DSM) which represents the surface of the Earth including buildings, infrastructure and vegetation. This DSM is derived from an edited DSM named WorldDEM, where flattening of water bodies and consistent flow of rivers has been included. In addition, editing of shore- and coastlines, special features such as airports, and implausible terrain structures has also been applied.
Model / methods: The WorldDEM product is based on the radar satellite data acquired during the TanDEM-X Mission
| Scope: | Global |
| Category: | Catchments |
| Data type: | GeoTiff (.tif), IMG, Arc ASCII Grid |
| Resolution: | 30 meter |
| Units: | m |

Availability: Available on a free basis for the general public under the terms and conditions of the License
Licence: © DLR e.V. (2014-2018) and © Airbus Defence and Space GmbH 2022 provided under COPERNICUS by the European Union and ESA; all rights reserved.
Reference: European Space Agency, Sinergise (2021). Copernicus Global Digital Elevation Model. Distributed by OpenTopography. https://doi.org/10.5069/G9028PQB. Accessed: 2024-04-16
uP36 GLO-90 Digital Elevation Model ⇑
🌐 https://portal.opentopography.org/raster?opentopoID=OTSDEM.032021.4326.1Description: The Copernicus DEM is a Digital Surface Model (DSM) which represents the surface of the Earth including buildings, infrastructure and vegetation. This DSM is derived from an edited DSM named WorldDEM, where flattening of water bodies and consistent flow of rivers has been included. In addition, editing of shore- and coastlines, special features such as airports, and implausible terrain structures has also been applied.
Model / methods: The WorldDEM product is based on the radar satellite data acquired during the TanDEM-X Mission
| Scope: | Global |
| Category: | Catchments |
| Data type: | GeoTiff (.tif), IMG, Arc ASCII Grid |
| Resolution: | 90 meter |
| Units: | m |
Availability: Available on a free basis for the general public under the terms and conditions of the License
Licence: © DLR e.V. (2014-2018) and © Airbus Defence and Space GmbH 2022 provided under COPERNICUS by the European Union and ESA; all rights reserved.
Reference: European Space Agency, Sinergise (2021). Copernicus Global Digital Elevation Model. Distributed by OpenTopography. https://doi.org/10.5069/G9028PQB. Accessed: 2024-04-16
uP37 GloboLakes: Lake Surface Water Temperature (LSWT) v4.0 (1995-2016) ⇑
🌐 https://catalogue.ceda.ac.uk/uuid/76a29c5b55204b66a40308fc2ba9cdb3Description: This dataset contains the GloboLakes LSWT v4.0 of daily observations of Lake Surface Water Temperature (LSWT), its uncertainty and quality levels. The dataset consist of two sets of files: 1) a single file per day on a 0.05° regular latitude- longitude grid covering the period from June 1995 to December 2016 (folder = daily), 2) a file per lake which contains the time series (daily) of the lake on a 0.05° regular grid (folder = per-lake). The list of the GloboLakes lakes is included as a CSV file and it contains name, GLWD identifier, coordinate of the lake centre and a set of coordinates that can be used to locate the lake in the daily-file dataset. The LSWTs consists of the daily observations of the temperature of the water (skin temperature). Uncertainty estimates and quality levels are provided for each value.
Model / methods: The LSWTs are obtained by combining the orbit data from the AVHRR (Advanced Very High Resolution Radiometer) on MetOpA, AATSR (Advanced Along Track Scanning Radiometer) on Envisat and ATSR-2 (Along Track Scanning Radiometer) on ERS-2 (European Remote Sensing Satellite). The temperatures from the different instruments have been derived with the same algorithm and harmonised to insure consistency for the period 1995-2016. The GloboLakes LSWT v4.0 was produced by the University of Reading in 2018 for long term observations of surface water temperature for about 1000 lakes globally.
| Scope: | Global |
| Category: | Catchments |
| Data type: | NetCDF (.nc) and BADC-CSV |
| Resolution: | 0.05° |
| Timepoints: | 1995-2016 |
| Units: | temperatures in Kelvin |
Availability: Requires to be CEDA user to download
Licence: Open Government License: https://www.nationalarchives.gov.uk/doc/open-government-licence/version/3/
Reference: Carrea, L.; Merchant, C.J. (2019): GloboLakes: Lake Surface Water Temperature (LSWT) v4.0 (1995-2016). Centre for Environmental Data Analysis, 29 March 2019. doi:10.5285/76a29c5b55204b66a40308fc2ba9cdb3. https://dx.doi.org/10.5285/76a29c5b55204b66a40308fc2ba9cdb3
uP38 GloboLakes: high-resolution global limnology dataset v1 ⇑
🌐 https://catalogue.ceda.ac.uk/uuid/84d4f66b668241328df0c43f8f3b3e16Description: These data are high-resolution datasets related to in-land water for limnology (study of in-land waters) and remote sensing applications. This includes: distance-to-land, distance-to-water, water-body identifier and lake-centre co-ordinates on a high-resolution (1/360x1/360 degree) grid, produced by the Department of Meteorology at the University of Reading. Datasets containing information to locate and identify water bodies have been generated from high-resolution (1/360x1/360 degree, about 300mx300m) data locating static-water-bodies recently released by the Land Cover Climate Change Initiative (LC CCI) of the European Space Agency. The new datasets provide: distance to land, distance to water, water body identifiers and lake centre locations. The lake identifiers (IDs) are from the Global Lakes and Wetlands Database (GLWD), and lake centres are defined for in-land waters for which GLWD IDs were determined. The new datasets therefore link recent lake/reservoir/wetlands extent to the GLWD, together with a set of coordinates which locates unambiguously the water bodies in the database.
Model / methods: Data was derived using the ESA CCI Land Cover Map (https://maps.elie.ucl.ac.be/CCI/viewer/index.php). The LC CCI water bodies dataset has been obtained from multi-temporal metrics based on time series of the backscattered intensity recorded by ASAR (Advanced Synthetic Aperture Radar) on Envisat between 2005 and 2010.
| Scope: | Global |
| Category: | Catchments |
| Data type: | NetCDF (.nc) and BADC-CSV |
| Resolution: | 1/360x1/360 degree (about 300mx300m) |
| Timepoints: | 2005-2010 |
| Units: | km |
Availability: Requires to be CEDA user to download
Licence: Open Government License: https://www.nationalarchives.gov.uk/doc/open-government-licence/version/3/
Reference: Carrea, L.; Embury, O.; Merchant, C.J. (2015): GloboLakes: high-resolution global limnology dataset v1. Centre for Environmental Data Analysis, 21 July 2015. doi:10.5285/6be871bc-9572-4345-bb9a-2c42d9d85ceb. https://dx.doi.org/10.5285/6be871bc-9572-4345-bb9a-2c42d9d85ceb
uP39 Global Biodiversity Information Facility (GBIF) ⇑
🌐 https://www.gbif.org/occurrence/downloadDescription: Species occurrence records. GBIF is an international network and data infrastructure funded by the world's governments and aimed at providing anyone, anywhere, open access to data about all types of life on Earth.
Model / methods: Records derive from many different kinds of sources, including everything from museum specimens collected in the 18th and 19th century to DNA barcodes and smartphone photos recorded in recent days and weeks.
| Scope: | Global |
| Category: | Biodiversity |
| Data type: | csv |
| Timepoints: | up to 2024 |
| Units: | occurrence status (present) |

Availability: Requires an account on GBIF
Licence: Different records under different CC licenses (CC0, CC BY 4.0 and CC BY-NC 4.0)
Reference: Each species page includes a default citation, for example: GBIF Secretariat: GBIF Backbone Taxonomy. https://doi.org/10.15468/39omei Accessed via https://www.gbif.org/species/5284517 [13 January 2020]. To cite GBIF in broad terms: GBIF: The Global Biodiversity Information Facility (year) What is GBIF?. Available from https://www.gbif.org/what-is-gbif [13 January 2020]. Full citation guidelines here: https://www.gbif.org/citation-guidelines
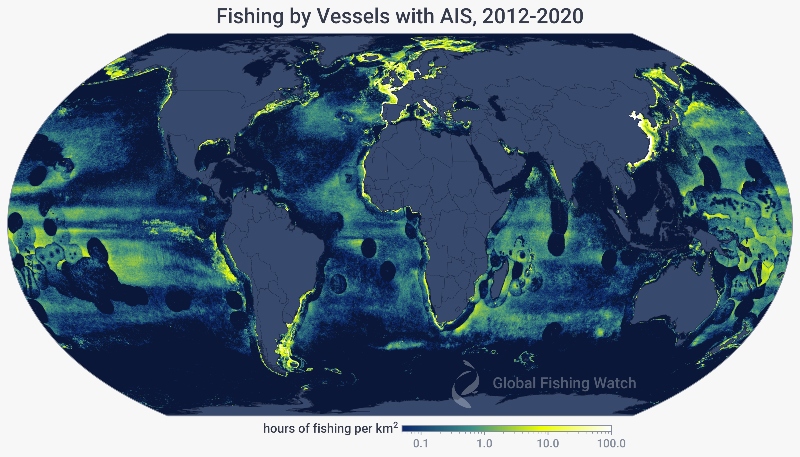
uP40 Global Fishing Watch ⇑
🌐 https://globalfishingwatch.org/map/Description: The Global Fishing Watch map is the first open-access online tool for visualization and analysis of vessel-based human activity at sea. Anyone with an internet connection can access the map to monitor global fishing activity from 2012 to the present for more than 65,000 commercial fishing vessels that are responsible for a significant part of global seafood catch. Apparent fishing effort: The heat map grid cell colors show how much fishing happened in that area, allowing for precise comparison. Vessel tracks and events: high-resolution vessel tracks in the map and “events'' that occurred along each track. Events highlight where fishing took place, port visits, vessel encounters and loitering events—when a single vessel exhibits behavior indicative of an encounter with another vessel but no other transmissions were received. Includes ocean barimethry and reference layers: Exclusive economic zones (EEZs), Marine protected areas (MPAs), FAO major fishing areas, Regional fisheries management organizations (RFMOs), High Seas. The Marine Managemer Portal includes environmental information: Chlorophyll-a concentration, Salinity, Sea surface temperature.
Model / methods: Apparent fishing effort: We use data that is broadcast using the automatic identification system (AIS) and collected via satellites and terrestrial receivers. We then combine this information with vessel monitoring system data provided by our partner countries. We apply our fishing detection algorithm to determine “apparent fishing effort” based on changes in vessel speed and direction.
| Scope: | Global |
| Category: | Environment |
| Data type: | .csv or JASON (non-spatial) or GEOTIFF (spatial) |
| Timepoints: | 2012-2024 |
| Units: | Apparent fishing effort and vessel presence in hours/km2. Detections unitless. Barimethry in meters. Chlorophyll-a concentration in mg m³. Salinity in PSU. Sea surface temperature in ºC. |
Availability: Requires login account, then download data from here: https://gateway.api.globalfishingwatch.org/auth?client=gfw&callback=https://globalfishingwatch.org/data-download/
Licence: Global Fishing Watch data is licensed for Non-Commercial use only. The Site and the Services are provided for Non-Commercial use only in accordance with the CC BY-NC 4.0 license. If you would like to use the Site and/or the Services for commercial purposes, please contact us.
Reference: To cite a screenshot, data product, or any other materials from our website, please include an attribution and use the following citation format: Global Fishing Watch. [2022 or current year in the copyright notice on the page visited]. Accessed on [date of access]. [Link to webpage].
uP41 Global Aquaculture Imports and Exports ⇑
🌐 https://www.kaggle.com/datasets/zhengtzer/global-fisheries-aquaculture-departmentDescription: This database contains statistics on the annual production of fishery commodities and imports and exports of fishery commodities by country and commodities in terms of volume and value from 2000 to 2015
Model / methods: data from fao.org
| Scope: | Global |
| Category: | Agriculture/Aquaculture |
| Data type: | .csv |
| Resolution: | country and continent |
| Timepoints: | 2000 - 2015 |
| Units: | Import Export in Quantity(t) and Import Export in Value(USD '000) |
Availability: Requires login account to download data
Licence: CC0: Public Domain
uP42 Global aquaculture production Quantity (1950 - 2021) ⇑
🌐 https://www.fao.org/fishery/statistics-query/en/aquaculture/aquaculture_quantityDescription: This database contains aquaculture production statistics by country or territory, species item, FAO Major Fishing Area and culture environment.
Model / methods: data from fao.org
| Scope: | Global |
| Category: | Agriculture/Aquaculture |
| Data type: | .csv |
| Resolution: | country or territory |
| Timepoints: | 1950-2021 |
| Units: | tonnnes (live weight) |
Availability: Available to download but must request license use: All requests for translation and adaptation rights, and for resale and other commercial use rights should be made via www.fao.org/contact-us/licence-request or addressed to copyright@fao.org.
Licence: This work is made available under the Creative Commons Attribution-NonCommercial-ShareAlike 3.0 IGO license (CC BY-NC-SA 3.0 IGO; https://creativecommons.org/licenses/by-nc-sa/3.0/igo ). In addition to this license, some database specific terms of use are listed: Terms of Use of Datasets.
Reference: The Food and Agriculture Organization of the United Nations ("FAO") is mandated to collect, analyze, interpret, and disseminate information related to nutrition, food, and agriculture. In this regard, it publishes a number of databases on topics related to FAO’s mandate, and encourages the use of them for statistical, scientific, and research purposes. Accordingly, all databases provide datasets free of charge, in machine-readable format, and subject to the terms of use of this agreement ("Dataset terms") and the Terms and Conditions regarding the Reuse of Web content , which are incorporated herein by reference.
uP43 Harmonized World Soil Database v2.0 (HWSD) ⇑
🌐 https://www.fao.org/soils-portal/data-hub/soil-maps-and-databases/harmonized-world-soil-database-v20/en/Description: Global soil inventory that offers detailed insights into soil properties, including their morphology, chemistry, and physical characteristics. HWSD v2.0 expands on its previous versions by including data from various national soil databases, offering detailed soil attributes for seven different soil layers (a significant increase from the two layers in HWSD v1.2), and adopting a consistent soil reference system combining FAO1990 standards with the World Reference Base for Soil Resources. Technical info and instructions here: https://openknowledge.fao.org/server/api/core/bitstreams/149f1562-bf6a-439f-9d3a-eb93940f39cf/content
Model / methods: Developed in 2008 by the International Institute for Applied Systems Analysis (IIASA) and the Food and Agriculture Organization of the United Nations (FAO). Seven source databases were used to compile version 2.0 of the HWSD: the European Soil Database (ESDB), the 1:1 million soil map of China, various regional and national SOTER databases (SOTWIS Database), the FAO/UNESCO Digital Soil Map of the World (FAO, 2003), the national soil map of Afghanistan (FAO and IIASA, 2022), the national soil map of Türkiye (Fischer and van Velthuizen, 2018b; TRGM, 2013) and the national soil map of Ghana (Boateng et al., 1999b).
| Scope: | Global |
| Category: | Catchments |
| Data type: | .mdb |
| Resolution: | 1km |
| Units: | see Table 2.1 in https://openknowledge.fao.org/server/api/core/bitstreams/149f1562-bf6a-439f-9d3a-eb93940f39cf/content |
Availability: Available to download
Licence: Creative Commons Attribution-NonCommercial-ShareAlike 3.0 IGO licence (CC BY-NC-SA 3.0 IGO; https://creativecommons.org/licenses/by-nc-sa/3.0/igo/legalcode). Under the terms of this licence, this work may be copied, redistributed and adapted for non-commercial purposes, provided that the work is appropriately cited. In any use of this work, there should be no suggestion that FAO endorses any specific organization, products or services. The use of the FAO logo is not permitted. If the work is adapted, then it must be licensed under the same or equivalent Creative Commons license. If a translation of this work is created, it must include the following disclaimer along with the required citation: “This translation was not created by the Food and Agriculture Organization of the United Nations (FAO). FAO is not responsible for the content or accuracy of this translation. The original English edition shall be the authoritative edition.”
Reference: FAO & IIASA. 2023. Harmonized World Soil Database version 2.0. Rome and Laxenburg. https://doi.org/10.4060/cc3823en
uP44 Per capita water withdrawal ⇑
🌐 http://www.fao.org/nr/water/aquastat/data/query/results.html🌐 https://ourworldindata.org/water-use-stress
Description: Average level of water withdrawal from agricultural, industrial and municipal purposes per person per year. Water withdrawal is defined as the quantity of freshwater taken from groundwater or surface water sources (such as lakes or rivers) for use in agricultural, industrial, or domestic purposes.
Model / methods: Data source: Food and Agriculture Organization of the United Nations - AQUASTAT
| Scope: | Global |
| Category: | Demographic |
| Data type: | .csv |
| Resolution: | country |
| Timepoints: | 1960-2015 |
| Units: | m3/year |
Availability: Available to download
Licence: CC BY 4.0 DEED
Reference: Water withdrawals and consumption - Aquastat – processed by Our World in Data. “Total water withdrawal per capita” [dataset]. Water withdrawals and consumption - Aquastat [original data].
uP45 Freshwater use in agriculture ⇑
🌐 http://www.fao.org/nr/water/aquastat/data/query/results.html🌐 https://ourworldindata.org/water-use-stress
Description: Total quantity of freshwater withdrawals that are used in agriculture, whether in the form of food crops, livestock, biofuels, or other non-food crop production.
Model / methods: Data source: Food and Agriculture Organization of the United Nations - AQUASTAT
| Scope: | Global |
| Category: | Agriculture/Aquaculture |
| Data type: | .csv |
| Resolution: | country |
| Timepoints: | 1965-2015 |
| Units: | m3/year |
Availability: Available to download
Licence: CC BY 4.0 DEED
Reference: Water withdrawals and consumption - Aquastat – processed by Our World in Data. “Agricultural water withdrawal” [dataset]. Water withdrawals and consumption - Aquastat [original data].
uP46 Share of agricultural land that is irrigated ⇑
🌐 https://datacatalog.worldbank.org/search/dataset/0037712/World-Development-Indicators🌐 https://ourworldindata.org/water-use-stress
Description: The percentage of total agricultural land area which is irrigated (i.e. purposely provided with water), including land irrigated by controlled flooding. Agricultural land is the combination of crop (arable) and grazing land.
Model / methods: Data source: Food and Agriculture Organization of the United Nations - AQUASTAT
| Scope: | Global |
| Category: | Agriculture/Aquaculture |
| Data type: | .csv |
| Resolution: | country |
| Timepoints: | 2001-2020 |
| Units: | % of total agricultural land/year |
Availability: Available to download
Licence: CC BY 4.0 DEED
Reference: Food and Agriculture Organization of the United Nations (via World Bank) – processed by Our World in Data. “Agricultural irrigated land (% of total agricultural land)” [dataset]. Food and Agriculture Organization of the United Nations (via World Bank) [original data].
uP47 Industrial water withdrawal ⇑
🌐 http://www.fao.org/nr/water/aquastat/data/query/results.html🌐 https://ourworldindata.org/water-use-stress
Description: The annual quantity of self-supplied water withdrawn for industrial uses. It includes water for the cooling of thermoelectric and nuclear power plants, but it does not include hydropower. Water withdrawn by industries that are connected to the public supply network is generally included in municipal water withdrawal
Model / methods: Data source: Food and Agriculture Organization of the United Nations - AQUASTAT
| Scope: | Global |
| Category: | Demographic |
| Data type: | .csv |
| Resolution: | country |
| Timepoints: | 1965-2015 |
| Units: | m3/year |
Availability: Available to download
Licence: CC BY 4.0 DEED
Reference: Water withdrawals and consumption - Aquastat – processed by Our World in Data. “Industrial water withdrawal” [dataset]. Water withdrawals and consumption - Aquastat [original data].
uP48 Municipal water withdrawal ⇑
🌐 http://www.fao.org/nr/water/aquastat/data/query/results.html🌐 https://ourworldindata.org/water-use-stress
Description: Total water withdrawal for municipal (domestic) purposes. Municipal water is defined as the water we use for domestic, household purposes, or public services. This is typically the most 'visible' form of water: the water we use for drinking, cleaning, washing, and cooking.
Model / methods: Data source: Food and Agriculture Organization of the United Nations - AQUASTAT
| Scope: | Global |
| Category: | Demographic |
| Data type: | .csv |
| Resolution: | country |
| Timepoints: | 1965-2016 |
| Units: | m3/year |
Availability: Available to download
Licence: CC BY 4.0 DEED
Reference: Water withdrawals and consumption - Aquastat – processed by Our World in Data. “Municipal water withdrawal” [dataset]. Water withdrawals and consumption - Aquastat [original data].
uP49 Water quality of global lakes ⇑
🌐 https://github.com/roohollahnoori/AWQDFGLDescription: Our database contains 264,061 unique Chla datapoints collected from 13,876 lakes in 77 countries worldwide, TP and TN in 138,591 locations. We also compiled information on additional water quality parameters for each of our lakes includeding NH4+, NO3¯/NO2¯, DO, DOS %, DOC, TOC, TON, TSS, and TFe. We collected the information for the lake surface area, lake perimeter, maximum depth and altitude, and the country in which the lake is located from the repositories used in our study
Model / methods: see figure 1 in methods of https://www.sciencedirect.com/science/article/pii/S0921344923005359#sec0002
| Scope: | Global |
| Category: | Environment |
| Data type: | .csv |
| Resolution: | points |
| Timepoints: | 1933–2022 |
| Units: | Chl-a in µg/L and TP and TN in µg/L |
Availability: Available to download
Licence: Request rights: https://s100.copyright.com/AppDispatchServlet?publisherName=ELS&contentID=S0921344923005359&orderBeanReset=true
Reference: Danial Naderian, Roohollah Noori, Essam Heggy, Sayed M. Bateni, Rabin Bhattarai, Ahmad Nohegar, Sapna Sharma. A water quality database for global lakes, Resources, Conservation and Recycling, Volume 202, 2024, 107401, ISSN 0921-3449, https://doi.org/10.1016/j.resconrec.2023.107401.
uP50 LIMNADES (Lake bio-optical measurements and match-up data for remote sensing) ⇑
🌐 https://www.eo4ukwater.stir.ac.uk/limnades/#:~:text=Limnades%20(Lake%20bio%2Doptical%20measurements,lakes%20and%20coastal%20waters%20worldwide.Description: In situ bio-optical measurements and satellite match-up data from lakes and coastal waters worldwide.
Model / methods: LIMNADES was developed in the framework of the GloboLakes project (http://www.globolakes.ac.uk/)
| Scope: | Global |
| Category: | Catchments |
Availability: Not available, must request from Stirling University. Register via website: https://www.eo4ukwater.stir.ac.uk/limnades/#:~:text=Limnades%20(Lake%20bio%2Doptical%20measurements,lakes%20and%20coastal%20waters%20worldwide.
Licence: Must request
uP51 Cost and Affordability of a Healthy Diet (CoAHD) ⇑
🌐 https://www.fao.org/faostat/en/#data/CAHDDescription: Indicators on the cost and affordability of a healthy diet are estimated in each country and show the population’s physical and economic access to least expensive locally available foods to meet requirements for a healthy diet, as defined in food-based dietary guidelines (FBDGs).
Model / methods: The indicators use observed retail food consumer prices and income distributions to provide an operational measure of people’s access to locally available foods in the proportions needed for health. See more in downloadable description and metadata https://www.fao.org/faostat/en/#data/CAHD
| Scope: | Global |
| Category: | Demographic |
| Data type: | .csv |
| Resolution: | country |
| Timepoints: | 2017-2021 |
| Units: | cost of healthy diet (PPP dollar per person per day), number of people unable to afford healthy diet (million) |
Availability: Available to download
Licence: Creative Commons Attribution-NonCommercial-ShareAlike 3.0 IGO (CC BY-NC-SA 3.0 IGO) - specified here https://www.fao.org/contact-us/terms/db-terms-of-use/en/
Reference: Different sources available in the description and metadata csv https://www.fao.org/faostat/en/#data/CAHD
uP52 Life expectancy ⇑
🌐 https://ourworldindata.org/life-expectancyDescription: The period life expectancy at birth, in a given year.
Model / methods: This data is compiled from three sources: the United Nations’ World Population Prospects (UN WPP), Zijdeman et al. (2015)2, and Riley (2005)3. For data points before 1950, we use Human Mortality Database data4 combined with Zijdeman (2015). From 1950 onwards, we use UN WPP data. For pre-1950 data on world regions and the world as a whole, we use estimates from Riley (2005).
| Scope: | Global |
| Category: | Demographic |
| Data type: | .csv |
| Resolution: | country |
| Timepoints: | 1543-2021 |
| Units: | years |
Availability: Available to download
Licence: CC BY 4.0 DEED
Reference: UN WPP (2022); HMD (2023); Zijdeman et al. (2015); Riley (2005) – with minor processing by Our World in Data. “Life expectancy at birth – Various sources – period tables” [dataset]. Human Mortality Database, “Human Mortality Database”; United Nations, “World Population Prospects 2022”; United Nations, “World Population Prospects”; Zijdeman et al., “Life Expectancy at birth 2”; James C. Riley, “Estimates of Regional and Global Life Expectancy, 1800-2001” [original data].
uP53 Global Subnational Infant Mortality Rates ⇑
🌐 https://sedac.ciesin.columbia.edu/data/set/povmap-global-subnational-infant-mortality-rates-v2-01/data-downloadDescription: The Global Subnational Infant Mortality Rates, Version 2.01 consist of Infant Mortality Rate (IMR) estimates for 234 countries and territories, 143 of which include subnational units. The data are benchmarked to the year 2015. In addition to Infant Mortality Rates, Version 2.01 includes crude estimates of births and infant deaths, which could be aggregated or disaggregated to different geographies to calculate infant mortality rates at different scales or resolutions, where births are the rate denominator and infant deaths are the rate numerator.
Model / methods: version 2.01, drawn from national offices, Demographic and Health Surveys (DHS), Multiple Boundary inputs are derived primarily from the Gridded Population of the World, Version 4 (GPWv4) data collection. Indicator Cluster Surveys (MICS), and other sources from 2006 to 2014.
| Scope: | Global |
| Category: | Demographic |
| Data type: | GeoTIFF (.tif) format, vector feature classes in Geodatabase (.gdb), and tabular data in Excel (.xlsx) format. |
| Resolution: | 1km |
| Timepoints: | 2015 |
| Units: | rate |
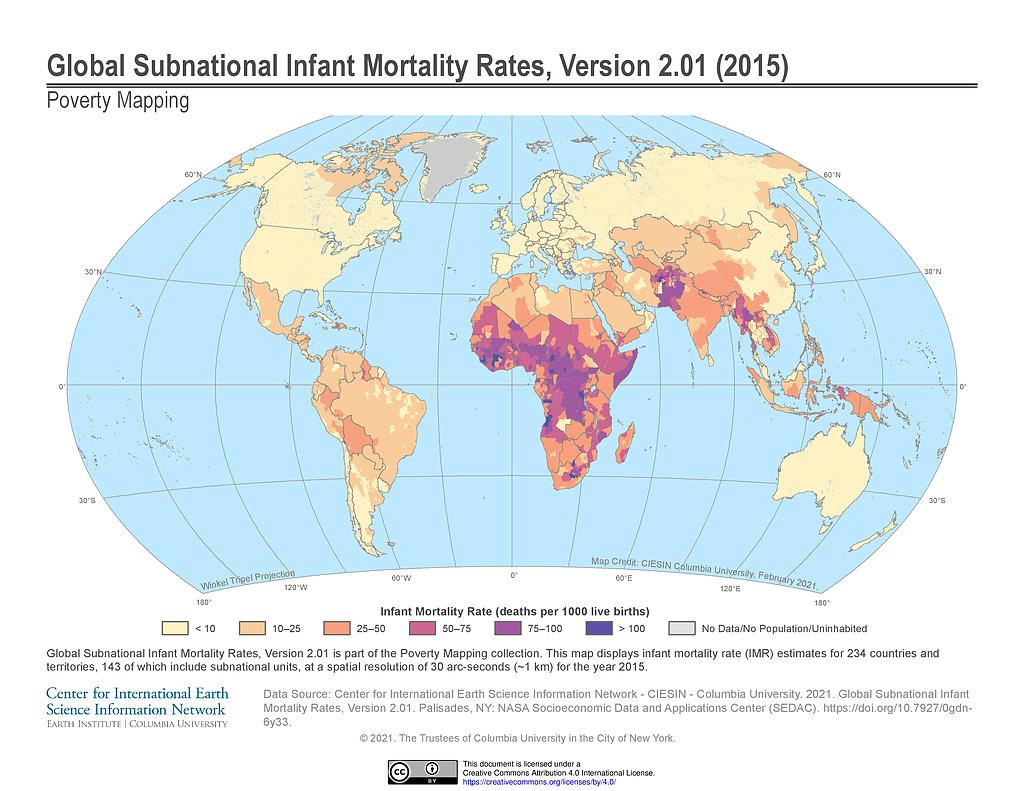
Availability: Available but need SEDAC login
Licence: Creative Commons Attribution 4.0 International License
Reference: Center for International Earth Science Information Network - CIESIN - Columbia University. 2021. Global Subnational Infant Mortality Rates, Version 2.01. Palisades, New York: NASA Socioeconomic Data and Applications Center (SEDAC). https://doi.org/10.7927/0gdn-6y33. Accessed DAY MONTH YEAR.
uP54 Cancer incidence ⇑
🌐 https://gco.iarc.fr/today/en/dataviz/maps-heatmap?mode=populationDescription: Age-Standardized cancer Rate (World) per 100 000, Incidence (both sexes), in 2022. CANCER TODAY enables a comprehensive assessment of the cancer burden worldwide in 2022, based on the GLOBOCAN estimates of incidence, mortality and prevalence for year 2022 in 185 countries or territories for 36 cancer types by sex and age group. An age-standardized rate (ASR) is a summary measure of the rate that would have been observed if the population had a standard age structure. Cancer incidence is the number of new cancer cases arising in a specified population over a given period of time (typically 1 year).
Model / methods: These estimates are based on the most recent data available to IARC through collaborations with population-based cancer registries (the International Association of Cancer Registries) and with the World Health Organization, or are based on information publicly available online
| Scope: | Global |
| Category: | Demographic |
| Data type: | xlsx or csv |
| Resolution: | country |
| Timepoints: | 2022 |
| Units: | rate |
Availability: Available but need SEDAC login
Licence: All rights reserved CANCER today
Reference: Sung H, Ferlay J, Siegel RL, Laversanne M, Soerjomataram I, Jemal A, Bray F. Global cancer statistics 2020: GLOBOCAN estimates of incidence and mortality worldwide for 36 cancers in 185 countries. CA Cancer J Clin. 2021 Feb 4. doi: 10.3322/caac.21660. Epub ahead of print. PMID: 33538338. Ferlay J, Colombet M, Soerjomataram I, Parkin DM, Piñeros M, Znaor A, Bray F. Cancer statistics for the year 2020: An overview. Int J Cancer. 2021 Apr 5. doi: 10.1002/ijc.33588. Epub ahead of print. PMID: 33818764.
uP55 Health expenditure as a share of GDP ⇑
🌐 https://ourworldindata.org/financing-healthcareDescription: Current health expenditure as a share of GDP provides an indication on the level of resources channelled to health relative to other uses. It shows the importance of the health sector in the whole economy and indicates the societal priority which health is given measured in monetary terms.
Model / methods: Current health expenditure (CHE) / Gross Domestic Product (GDP)
| Scope: | Global |
| Category: | Demographic |
| Data type: | .csv |
| Resolution: | country |
| Timepoints: | 2000-2021 |
| Units: | % of GDP |
Availability: Available
Licence: CC BY 4.0 DEED
Reference: World Health Organization - Global Health Observatory (2024) – processed by Our World in Data. “Current health expenditure (CHE) as percentage of gross domestic product (GDP) (%)” [dataset]. World Health Organization, “Global Health Observatory” [original data].
uP56 Government health expenditure as share of GDP ⇑
🌐 https://nextjournal.com/fiona-spooner/government-health-expenditure🌐 https://ourworldindata.org/financing-healthcare
Description: Health spending includes final consumption of health care goods and services (i.e. current health expenditure). This excludes spending on capital investments.
Model / methods: based on Lindert (1994), OECD (1993), OECD Stat
| Scope: | Global |
| Category: | Demographic |
| Data type: | .csv |
| Resolution: | country |
| Timepoints: | 1880-2021 |
| Units: | % of GDP |
Availability: Available
Licence: CC BY 4.0 DEED
Reference: Our World In Data based on Lindert (1994), OECD (1993), OECD Stat – processed by Our World in Data. “public_health_expenditure_pc_gdp” [dataset]. Our World In Data based on Lindert (1994), OECD (1993), OECD Stat [original data].
uP57 In Situ Global Lakes & Reservoirs ⇑
🌐 https://nora.nerc.ac.uk/id/eprint/537299/1/Global_Lakes_Reservoirs_Report_v1.pdfDescription: Metadata and access requirements for various readily available in situ data sources related to water body levels and/or storage. Metadata includes continent, country, notes, website, n of water bodies, propietor, how monitored, reservoir name, start and end year of timeseries, temporal resolution, data presented as, downloadable, file type.
Model / methods: Searches were initially conducted based on National Hydro-Meteorological Organisation websites and portals, as set out in the Copernicus In Situ Global Hydrological In Situ Data Review (Fry and Nash, 2021). Further searches were conducted via keywords in the Google and Google Scholar search engines, whilst some entries were included based on a previous knowledge of relevant datasets
| Scope: | Global |
| Category: | Nutrients |
| Data type: | Excel |
| Resolution: | country |
| Timepoints: | various, depending on country |
| Units: | see metadatabase |
Availability: Available to download
Reference: Nathan Rickards; Rishma Chengot; Helen Baron, Global catalogue of water body data v1.0, 2023
uP73 Lake-TopoCat ⇑
🌐 https://zenodo.org/records/7916729Description: A global Lake drainage Topology and Catchment database. LakeTopoCat contains the outlet(s) and catchment(s) of each lake; the interconnecting reaches among lakes; and a wide suite of attributes depicting lake drainage topology such as upstream and downstream relationship, drainage distance between lakes, and a priori drainage type and connectivity with river networks
Model / methods: This version of Lake-TopoCat was constructed using the HydroLAKES v1.0 (Messager et al., 2016) lake mask and the 3-arc-second-resolution hydrography dataset MERIT Hydro v1.0.1 (Yamazaki et al., 2019). The drainage type of each HydroLAKES lake, such as isolated, inflow-headwater, headwater, flow-through, terminal, and coastal, was determined with assistance of MERIT Hydro-Vector (Lin et al., 2021), a high-resolution river network dataset with spatially-variable drainage densities. Furthermore, the seasonal or intra-annual stability of water area in each HydroLAKES lake was calculated using six-year (2010–2015) statistics from the Global Lake area, Climate, and Population (GLCP) database (Meyer et al., 2020).
| Scope: | Global |
| Category: | Catchments |
| Data type: | shapefile |
| Resolution: | lake and catchment |
| Units: | km2 and meters |
Availability: Available to download
Licence: CC By 4.0 International
Reference: Sikder, M. S., Wang, J., Allen, G. H., Sheng, Y., Yamazaki, D., Song, C., Ding, M., Crétaux, J.-F., and Pavelsky, T. M., 2023. Lake-TopoCat: A global lake drainage topology and catchment dataset. Earth System Science Data, 15, 3483-3511, https://doi.org/10.5194/essd-15-3483-2023
uP74 ISIMIP3ab Simulation Data from the Global Lakes Sector: soil input ⇑
🌐 https://data.isimip.org/datasets/9516b09a-11ce-40b5-896c-9dcc9605dff3/Description: The Inter-Sectoral Impact Model Intercomparison Project (ISIMIP) provides a framework for the collation of a consistent set of climate impact data across sectors and scales. In ISIMIP 3a/3b two soil data sets are provided. The first provides an upscaled map of soil textures that is based on the HWSD 1.1 soil data and was already used in ISIMIP2a. The second, newer one, is provided by the AgMIP project and gives the properties of a grid cell's dominant soil texture as well the properties of the soil predominantly occurring on crop lands. One file, hwsd_soil_data_all_land.nc, gives the properties of the dominant soil type within a grid cell. Variables: properties USDA soil texture class dominant HWSD on cropland ("texture_class"), dominant HWSD soil mapping unit within dominant USDA soil texture class on cropland ("mu_global"), topsoil pH("H2O") ("soil_ph"), topsoil calcium carbonate ("soil_caco3"), topsoil bulk density ("bulk_density"), topsoil cation exchange capacity ("soil") ("cec_soil"), topsoil organic carbon ("oc"), depth of obstacles to roots ("esdb") ("root_obstacles"), depth of impermeable layer ("esdb") ("impermeable_layer"), available water content ("awc"), topsoil sand fraction ("sand"), topsoil silt fraction ("silt"), topsoil clay fraction ("clay"), topsoil gravel content ("gravel"), topsoil salinity ("ece"), topsoil base saturation ("bs_soil") and a flag for valid soils ("issoil").
Model / methods: The ISIMIP3a part of the third simulation round is dedicated to i) impact model evaluation and improvement and ii) detection and attribution of observed impacts according to the framework of IPCC AR5 Working Group II Chapter 18. To this end all simulations are driven by observed socio-economic information combined with either observed (factual) climate data or a detrended (counterfactual) version of the observed climate allowing for the generation of a "no climate change" baseline. The ISIMIP3b part of the third simulation round is dedicated to a quantification of climate-related risks at different levels of global warming and socio-economic change. ISIMIP3b group I simulations are based on historical climate change as simulated in CMIP6 combined with observed historical socio-economic forcing. ISIMIP3b group II simulations are based on climate change according to the CMIP6 future projections combined with socio-economic forcings fixed at 2015 levels. ISIMIP3b group III simulations additionally account for future changes in socio-economic forcing.
| Scope: | Global |
| Category: | Environment |
| Data type: | NetCDF |
| Resolution: | 0.5°×0.5° |
| Units: | depending on variable |
Availability: Available to download
Licence: CC0 1.0 Universal Public Domain Dedication (CC0 1.0)
Reference: Jan Volkholz, Christoph Müller (2020): ISIMIP3 soil input data (v1.0). ISIMIP Repository. https://doi.org/10.48364/ISIMIP.942125
uP75 ISIMIP2ab Simulation Data from the Global Lakes Sector: windspeed (historical and projected) ⇑
🌐 https://data.isimip.org/datasets/9ad96538-c94d-4a80-a771-cea8ce8f656c/🌐 https://data.isimip.org/datasets/c431d231-60c8-4bc4-af4a-1b4f7667c14a/
Description: The Inter-Sectoral Impact Model Intercomparison Project (ISIMIP) provides a framework for the collation of a set of consistent, multi-sector, multi-scale climate-impact simulations, based on scientifically and politically relevant historical and future scenarios. ISIMIP2b is the second simulation round of the second phase of ISIMIP. This dataset covers the CMIP5-based and bias-adjusted atmospheric climate input data for all three groups of ISIMIP2b simulations.
Model / methods: Raw CMIP5 model outputs were conservatively interpolated to 0.5° horizontal resolution and then bias-adjusted using the observational reference dataset EWEMBI v1.1 (Lange, 2018; Lange 2019) and an augmented version of the Hempel et al. (2013) method (Lange, 2017). For more details see the ISIMIP2b protocol paper (Frieler et al. 2017).
| Scope: | Global |
| Category: | Environment |
| Data type: | NetCDF |
| Resolution: | 0.5°×0.5° |
| Timepoints: | 2006-2300 |
| Units: | m/s |
| RCP(s): | RCP2.6, RCP6.0, RCP8.5 |
Availability: Available to download
Licence: CC0 1.0 Universal Public Domain Dedication (CC0 1.0)
Reference: Stefan Lange, Matthias Büchner (2017): ISIMIP2b bias-adjusted atmospheric climate input data (v1.0). ISIMIP Repository. https://doi.org/10.48364/ISIMIP.208515
uP76 CLARA-A3: CM SAF cLoud, Albedo and surface RAdiation dataset from AVHRR data - Edition 3 ⇑
🌐 https://wui.cmsaf.eu/safira/action/viewDoiDetails?acronym=CLARA_AVHRR_V003Description: CLARA-A3 features a range of cloud products: cloud mask, cloud top temperature/pressure/height, cloud thermodynamic phase, and (for liquid and ice clouds separately) cloud optical thickness, particle effective radius and cloud water path. Additionally, cloud droplet number concentration and cloud geometrical thickness are provided for liquid clouds. Furthermore, a range of radiation products are included in CLARA-A3: surface black-sky, white-sky and blue-sky albedo; surface downwelling short- and longwave radiation as well as surface net radiation; top-of-atmosphere (TOA) upwelling short- and longwave radiation. Cloud products are available as monthly and daily averages and histograms, as well as daily resampled global products (Level 2b) for individual satellites. Surface albedo is presented as monthly and pentad (5 day) averages. Surface and TOA radiation products are provided as daily and monthly averages. All averages are available on a 0.25° x 0.25° global grid. Surface albedo and selected cloud products are also provided on two equal area grids with a resolution of 25 km x 25 km covering the polar regions. Daily resampled cloud products (level 2b) are provided in a global grid with a resolution of 0.05°x0.05°. CLARA-A3 features a comprehensive set of documentation including User Manuals, Validation Reports and Algorithms Theoretical Baseline Documents.
Model / methods: The CLARA-A3 record provides cloud properties and radiation parameters derived from the AVHRR sensor onboard polar orbiting NOAA and METOP satellites. CLARA-A3 is the latest edition of CLARA with previous editions documented in Karlsson et al. (2013) and Karlsson et al. (2017). CLARA-A3 covers the time period 1979/01/01 until 2020/12/31 as climate data record (CDR), but is operationally extended as interim climate data record (ICDR) to the present with a latency of 10 days. The AVHRR measurement input to the CLARA-A3 retrieval algorithms is the EUMETSAT PyGAC AVHRR Fundamental Data Record (FDR) Release 1 (DOI:10.15770/EUM_SEC_CLM_0060).
| Scope: | Global |
| Category: | Environment |
| Data type: | NetCDF-4 |
| Resolution: | 0.25 degree |
| Timepoints: | 1979-01-01 - present |
| Units: | % |
Availability: Need login
Licence: Distributed freely
Reference: Karlsson, Karl-Göran; Riihelä, Aku; Trentmann, Jörg; Stengel, Martin; Solodovnik, Irina; Meirink, Jan Fokke; Devasthale, Abhay; Jääskeläinen, Emmihenna; Kallio-Myers, Viivi; Eliasson, Salomon; Benas, Nikos; Johansson, Erik; Stein, Diana; Finkensieper, Stephan; Håkansson, Nina; Akkermans, Tom; Clerbaux, Nicolas; Selbach, Nathalie; Schröder, Marc; Hollmann, Rainer (2023): CLARA-A3: CM SAF cLoud, Albedo and surface RAdiation dataset from AVHRR data - Edition 3, Satellite Application Facility on Climate Monitoring, DOI:10.5676/EUM_SAF_CM/CLARA_AVHRR/V003, https://doi.org/10.5676/EUM_SAF_CM/CLARA_AVHRR/V003. [BibTeX entry]
uP77 World Bank GDP (current $) ⇑
🌐 https://data.worldbank.org/indicator/NY.GDP.MKTP.CD?skipRedirection=true&view=map&year=2023Description: GDP is the sum of gross value added by all resident producers in the economy plus any product taxes and minus any subsidies not included in the value of the products.
Model / methods: World Bank national accounts data, and OECD National Accounts data files.
| Scope: | Global |
| Category: | Demographic |
| Data type: | csv, Excel, xml |
| Resolution: | country |
| Timepoints: | 1960-2023 |
| Units: | current US$ |
Availability: Available to download
Licence: CC BY-4.0
Reference: World Bank national accounts data, and OECD National Accounts data files.
uP78 World Bank GDP growth ⇑
🌐 GDP growth (annual %) | Data (worldbank.org)Description: Annual percentage growth rate of GDP at market prices based on constant local currency - aggregates are based on constant 2015 prices, expressed in U.S. dollars.
Model / methods: World Bank national accounts data, and OECD National Accounts data files.
| Scope: | Global |
| Category: | Demographic |
| Data type: | csv, Excel, xml |
| Resolution: | country |
| Timepoints: | 1961-2023 |
| Units: | annual % |
Availability: Available to download
Licence: CC BY-4.1
Reference: World Bank national accounts data, and OECD National Accounts data files.
uP79 Country Boundaries (various) ⇑
Description: Country boundaries using a number of different definitions and sources.
| Scope: | Global |
| Category: | Demographic |
Availability: Contact Philip Taylor (philor@ceh.ac.uk)
uP82 MERRA2 Wind Data ⇑
🌐 https://disc.gsfc.nasa.gov/datasets/M2TMNXSLV_5.12.4/summary?keywords=Single-Level%20DiagnosticsDescription: Time-averaged 2-dimensional monthly mean data collection in Modern-Era Retrospective analysis for Research and Applications version 2 (MERRA-2). This collection consists of meteorology diagnostics at popularly used vertical levels, such as air temperature at 2-meter (or at 10-meter, 850hPa, 500 hPa, 250hPa), wind components at 50-meter (or at 2-meter, 10-meter, 850hPa, 500hPa, 250 hPa), sea level pressure, surface pressure, and total precipitable water vapor (or ice water, liquid water). The collection also includes variance of certain parameters.
Model / methods: MERRA-2 is the latest version of global atmospheric reanalysis for the satellite era produced by NASA Global Modeling and Assimilation Office (GMAO) using the Goddard Earth Observing System Model (GEOS) version 5.12.4.
| Scope: | Global |
| Category: | Environment |
| Data type: | NetCDF |
| Resolution: | 0.5 ° x 0.625 ° |
| Timepoints: | 1980-01-01 to 2024-06-01 |
| Units: | meter and hPa |
Availability: Available to download after registering to NASA Earthdata
Reference: Global Modeling and Assimilation Office (GMAO) (2015), MERRA-2 tavgM_2d_slv_Nx: 2d,Monthly mean,Time-Averaged,Single-Level,Assimilation,Single-Level Diagnostics V5.12.4, Greenbelt, MD, USA, Goddard Earth Sciences Data and Information Services Center (GES DISC), Accessed: [Data Access Date], 10.5067/AP1B0BA5PD2K
uP83 BACI Phosphorus ⇑
🌐 http://www.cepii.fr/CEPII/en/bdd_modele/bdd_modele_item.asp?id=37Description: BACI provides data on bilateral trade flows for 200 countries at the product level (5000 products). Products correspond to the "Harmonized System" nomenclature (6 digit code). Variables: year, product category, exporter, importer, value of trade flow, quantity. See documentation http://www.cepii.fr/DATA_DOWNLOAD/baci/doc/DescriptionBACI.html
Model / methods: BACI relies on data from the United Nations Statistical Division (Comtrade dataset). Since countries report both their imports and their exports to the United Nations, the raw data we use may have duplicates flows: trade from country i to country j may be reported by i as an export to j and by j as an import from i. The reported values should match, but in practice are virtually never identical, for two reasons: 1) Import values are reported CIF (cost, insurance and freight) while exports are reported FOB (free on board). 2) Mistakes are made, because of uncertainty on the final destination of exports, discrepancies in the classification of a given product, etc... BACI provides a unique, reconciled trade flow by implementing an harmonization procedure whose two main ingredients are: 1) CIF costs are estimated and removed from import values to compute FOB import values. 2) The reliability of each country as a reporter of trade data is assessed. If a reporter tends to provide data that are very different from the ones of its partners, it will be considered as unreliable and will be assigned a lower weight in the determination of the reconciled trade flow value.
| Scope: | Global |
| Category: | Nutrients |
| Data type: | csv |
| Resolution: | country |
| Timepoints: | 1995-2022 |
| Units: | Value of the trade flow (in thousands current USD) and Quantity (in metric tons) |
Availability: Available to download after registering to NASA Earthdata
Licence: Open License 2.0
Reference: Gaulier, G. and Zignago, S. (2010) BACI: International Trade Database at the Product-Level. The 1994-2007 Version. CEPII Working Paper, N°2010-23.
uP84 WITS Phosphorus ⇑
🌐 https://wits.worldbank.org/trade/comtrade/en/country/ALL/year/2021/tradeflow/Exports/partner/WLD/product/280470#Description: The World Integrated Trade Solution (WITS) software provides access to international merchandise trade, tariff and non-tariff measures (NTM) data. Browse the Country profile section to obtain countries exports, imports and tariff statistics along with relevant development data. WITS gives access to several major trade flow & tariff databases: the UN Comtrade; the UNCTAD TRAINS; the WTO IDB and CTS;
| Scope: | Global |
| Category: | Nutrients |
| Data type: | Excel |
| Resolution: | country |
| Timepoints: | 2021 |
| Units: | US$ and kg |
Availability: 1. The availability of the international trade statistics of UN Comtrade (The United Nations Commodity Trade Statistics database) via the WITS application has been made possible with the permission of the United Nations. UN Comtrade contains annual imports and exports statistics for more than 160 reporting countries or areas, which account for almost all trade worldwide. The trade statistics are detailed giving value and quantity for each commodity broken down by trading partner. These data are copyrighted by the United Nations. They are made available for internal use only and may not be re-disseminated in any form without written permission of the United Nations Statistics Division (UNSD). 2. Free unlimited access to UN Comtrade is available for all users on the website of the United Nations Statistics Division (UNSD) at http://Comtrade.un.org/db/default.aspx . A download limit of 100,000 data records per query is applicable for technical reasons. There is no limit on the number of queries. The same free access and limitations apply for obtaining UN Comtrade data via the WITS application. 3. Institutional users from developing countries and users from International Organizations can request registration at the UN Comtrade website and will be provided with special arrangements (for details see https://unp.un.org/Comtrade.aspx). Those special arrangements would apply also to download of UN Comtrade data via WITS, once registered at the UN Comtrade site. 4. UN Comtrade offers Premium access, which allows for downloads of more than 100,000 records and for the use of advanced functions of UN Comtrade. Premium access is payable. For details on how to obtain such access see https://unp.un.org/Comtrade.aspx. Premium access to UN Comtrade via WITS can be obtained in the same way.
Licence: Subject to license agreement
uP85 Resource Trade Phosphorus ⇑
🌐 https://resourcetrade.earth/?category=122&units=value&autozoom=1Description: The trade data on this site are from the Chatham House Resource Trade Database (CHRTD). The CHRTD is a repository of bilateral trade in natural resources between more than 200 countries and territories. The database includes the monetary values and masses of trade in over 1,350 different types of natural resources and resource products, including agricultural, fishery and forestry products, fossil fuels, metals and other minerals, and pearls and gemstones. It contains raw materials, intermediate products, and by-products. Phosphorus related variables include: phosphatic fertilisers, diammonium phosphate, fertilisers with N and P, monoammonium Phosphates
Model / methods: resourcetrade.earth has been developed by Chatham House to enable users to explore the fast-evolving dynamics of international trade in natural resources, the sustainability implications of such trade, and the related interdependencies that emerge between importing and exporting countries and regions.
| Scope: | Global |
| Category: | Nutrients |
| Data type: | Excel |
| Resolution: | country |
| Timepoints: | 2000-2022 |
| Units: | Value (US$) or weight (tonnes) |
Availability: Available to download
Reference: Chatham House (2021), ‘resourcetrade.earth’, https://resourcetrade.earth/
uP86 GloboLakes chl-a ⇑
🌐 https://www.globolakes.stir.ac.uk/Description: Chlorophyll-a values for ~1000 global lakes (with ~800 matching to Lake-TopoCat polygons). This dataset was generated as part of the Globolakes project and made available for use in uPcycle.
| Scope: | Global |
| Category: | Nutrients |
Availability: Contact Philip Taylor (philor@ceh.ac.uk)
Licence: Permission would need to be sought for (re) publishing.
uP88 Global Aridity Index and Potential Evapotranspiration Climate Database v3 (historical and future) ⇑
🌐 https://www.scidb.cn/en/detail?dataSetId=11e920c1ee144fc2a691951096b96cbcDescription: Global raster dataset of average monthly and annual potential evapotransipation (PET) and aridity index (AI). PET datasets are available as monthly averages (12 datasets, i.e. one dataset for each month, averaged over the specified time period) or as an annual average (1 dataset) for the specified time period.
Model / methods: Based on the results of comparative validations, the Hargreaves model has been evaluated as one of the best fit to model PET and Aridity index globally with the available high resolution downscaled and bias corrected climate projections and chosen for the implementation of the Global-AI_PET- CMIP6 Future Projections. This method performs almost as well as the Penman-Monteith method, but requires less parameterization, and has significantly lower sensitivity to error in climatic inputs (Hargreaves and Allen, 2003). The currently available downscaled CMIP6 projections (available from WorldClim) do provide fewer climate variables idoneous for implementation of temperature-based evapotranspiration methods, such as the Hargreaves method.
| Scope: | Global |
| Category: | Climate |
| Data type: | tif |
| Resolution: | 30 arc sec |
| Timepoints: | historical (1960-1990; 1970-2000)and future (2021-2040; 2041-2060) |
| Units: | total mm of pet per month or year |
| RCP(s): | SSP: 126, 245, 370, 585 |
| SSP(s): | SSP 1,2,3,5 |
Availability: Available to download
Licence: CC By 4.0
Reference: Robert John Zomer, Antonio Trabucco. Future Global Aridity Index and PET Database (CMIP_6)[DS/OL]. V6. Science Data Bank, 2024[2024-07-10]. https://cstr.cn/16666.11.sciencedb.nbsdc.00086. CSTR:16666.11.sciencedb.nbsdc.00086.
uP90 Global Peatland Database ⇑
🌐 https://greifswaldmoor.de/global-peatland-database-en.htmlDescription: The GPD collates and integrates data on location, extent and drainage status of peatlands and organic soils worldwide and for 268 individual countries and regions. The map covers the peatlands of the world in a grid of 1 x 1 km. The dataset has 2 very rough categories: 1=peat dominated 2=peat in soil mosaic. Because of the huge differences between the more than 200 single datasets, these 2 groups do not have any fixed tresholds and are more like a expert judgement to not overestimate peat extent where it interferes with mineral soil types.
Model / methods: The Global Peatland Database (GPD) is a project of the International Mire Conservation Group (IMCG) located and maintained at the Greifswald Mire Centre.
| Scope: | Global |
| Category: | Environment |
| Data type: | geotiff |
| Resolution: | 1km x 1km |
| Units: | binary (peat dominated, peat in soil mosaic) |
| RCP(s): | SSP: 126, 245, 370, 586 |
| SSP(s): | SSP 1,2,3,6 |
Availability: Available to download
Reference: Based on data from the Global Peatland Database / Greifswald Mire Centre (year)
uP91 Precipitation (historical and projected) ⇑
🌐 https://catalogue.ceda.ac.uk/uuid/c107618f1db34801bb88a1e927b82317Description: Global gridded daily precipitation for the historical (1981–2014) and future (2015–2100) periods at 0.25° resolution and at daily time step across three Shared Socioeconomic Pathways (SSP2-4.5, SSP5-3.4-OS and SSP5-8.5).
Model / methods: Novel statistical downscaling model capable of replicating extreme events, the Bias Correction Constructed Analogues with Quantile mapping reordering (BCCAQ), to downscale daily precipitation, air-temperature, maximum and minimum temperature, wind speed, air pressure, and relative humidity from 18 GCMs from the Coupled Model Intercomparison Project Phase 6 (CMIP6). BCCAQ is calibrated using high-resolution reference datasets and showed a good performance in removing bias from GCMs and reproducing extreme events.
| Scope: | Global |
| Category: | Climate |
| Data type: | NetCDF |
| Resolution: | 0.25 degree |
| Timepoints: | historical (1981–2014) and future (2015–2100) |
| Units: | mm/day |
| RCP(s): | SSP2-4.5, SSP5-3.4-OS and SSP5-8.5 |
| SSP(s): | SSP2, SSP5 |
Availability: Available to download with CEDA login
Reference: Paper: Gebrechorkos, S., Leyland, J., Slater, L. et al. A high-resolution daily global dataset of statistically downscaled CMIP6 models for climate impact analyses. Sci Data 10, 611 (2023). https://doi.org/10.1038/s41597-023-02528-x and CEDA: School of Geography and Environmental Science, University of Southampton, UK; Gebrechorkos, S.; Leyland, J.; Darby, S.; Parsons, D. (2022): High-resolution daily global climate dataset of BCCAQ statistically downscaled CMIP6 models for the EVOFLOOD project. NERC EDS Centre for Environmental Data Analysis, 14 December 2022. doi:10.5285/c107618f1db34801bb88a1e927b82317. https://dx.doi.org/10.5285/c107618f1db34801bb88a1e927b82317
uP92 Cropland Nutrient Balance (including nutrient use efficiency) ⇑
🌐 https://www.fao.org/faostat/en/#data/ESBDescription: The Cropland Nutrient Budget domain contains information on the flows of nitrogen, phosphorus, and potassium from synthetic fertilizer, manure applied to soils, atmospheric deposition, crop removal, and biological fixation over cropland and per unit area of cropland. The flows are aggregated to total inputs and total outputs, from which the overall nutrient budget and nutrient use efficiency on cropland are calculated.
Model / methods: See details in metadata number 17 (https://www.fao.org/faostat/en/#data/ESB/metadata)
| Scope: | Global |
| Category: | Nutrients |
| Data type: | csv and xls |
| Resolution: | country |
| Timepoints: | 1961-2020 |
| Units: | Statistics are disseminated in units of tonnes and in kg/ha, as appropriate. Nutrient use efficiency is expressed as a fraction (%). |
Availability: Available
Licence: FAO Statistical Database Terms of Use https://www.fao.org/contact-us/terms/db-terms-of-use/en/ and CC BY-NC-SA 3.0 IGO https://creativecommons.org/licenses/by-nc-sa/3.0/igo/
Reference: FAO. 2022. Land, Inputs and Sustainability / Cropland Nutrient Budget [Accessed on 24/07/2024]. [https://www.fao.org/faostat/en/#data/ESB] Licence: CC-BY-4.0.
uP93 IUCN Red List of Threatened Species ⇑
🌐 https://www.iucnredlist.org/resources/spatial-data-downloadDescription: The IUCN Red List of Threatened Species™ contains global assessments for more than 163,000 species. More than 83% of these (>136,200 species) have spatial data. The spatial data provided below are mostly for comprehensively assessed taxonomic groups and selected freshwater groups.
Model / methods: https://www.iucnredlist.org/assessment/process
| Scope: | Global |
| Category: | Biodiversity |
| Data type: | ESRI shp (polygons), csv (points) and csv (hydrobasins) |
| Resolution: | country |
| Timepoints: | 1996-2024 |
| Units: | number of species |

Availability: Need to submit request
Licence: https://www.iucnredlist.org/terms/terms-of-use
Reference: IUCN
uP94 Framework for Ecosytem Restoration Monitoring (FERM) ⇑
🌐 https://data.apps.fao.org/ferm/?lang=enDescription: To track the progress of efforts to restore degraded ecosystems, FAO and partners have developed an operational monitoring framework for the United Nations Decade on Ecosystem Restoration. As outlined in the Decade's Strategy, the Framework for Ecosystem Restoration Monitoring (FERM) builds on and complements, existing international, regional and national reporting processes, their goals, targets, criteria and indicators. Under one platform, anyone can examine the progress of restoration, and access methodological guidance and tools to monitor ecosystem restoration, as well create and visualize their own restoration data. The FERM provides transparent monitoring of restoration progress using 20 headline indicators indicators, drawn from existing country reported data to Sustainable Development Goals and Multi-lateral Environmental Agreements. The FERM also provides access to geospatial information related to ecosystem restoration and provides access to innovative tools for monitoring restoration, and allows stakeholders to share their project information through the FERM Registry, contributing to the overall monitoring of the progress of the UN Decade on Ecosystem Restoration.
Model / methods: The FERM has been developed by the Task Force on Monitoring - a collaborative effort across 315 technical experts from 112 organizations.
| Scope: | Global |
| Category: | Catchments |
| Data type: | csv or json |
| Resolution: | points (transboundary) |
| Timepoints: | 2021-2030 |
| Units: | ha |
Availability: Need to have a login. See https://ferm.fao.org/docs/ferm_user_guide_draft.pdf
Licence: The FERM currently does not have a data sharing license, but is considering using CC BY-NC 4.0. Also see FAO terms of use https://www.fao.org/contact-us/terms/en/
Reference: [© FAO] [Year of publication] [Title of content] [Page number (for publications)] [Location on FAO website] [Date accessed and/or downloaded]
uP95 Index of coastal eutrophication potential ⇑
🌐 https://unstats.un.org/sdgs/dataportal/databaseDescription: The indicator is a subset of the indicators used for SDG 14.1.1. The indicator aims to measure the contribution to coastal eutrophication from countries and the state of coastal eutrophication. Therefore, two levels of indicators are recommended: Level 1: Globally available data from earth observations and modelling Level 2: National data collected from countries (through the relevant Regional Seas Programme where applicable, that is, for countries that are a member of a Regional Seas Programme)
Model / methods: Level 1: Indicator for coastal eutrophication potential. This indicator is based on loads and ratios of nitrogen, phosphorous and silica delivered by rivers to coastal waters (Garnier et al. 2010), which contribute to the ICEP. Level 2: National ICEP modelling. Existing ICEP modelling at the national level is limited but could be further developed following the model of a current study analysing basin level data in Chinese rivers (Strokal et al. 2016). See here for specific https://www.gbf-indicators.org/metadata/headline/7-1
| Scope: | Global |
| Category: | Environment |
| Data type: | xls |
| Resolution: | Global, Regional, National |
| Timepoints: | 2000-2023 |
| Units: | Indicator for Coastal Eutrophication Potential (ICEP): kilograms of carbon (from algae biomass) per square kilometre of river basin area per day (kg C km-2 day-1). |
Availability: Available to download (search 14.1.1)
Licence: All rights reserved (https://www.un.org/en/about-us/copyright/). See terms of use https://www.un.org/en/about-us/terms-of-use
uP96 Red List Index ⇑
🌐 https://unstats.un.org/sdgs/dataportal/databaseDescription: The Red List Index measures change in aggregate extinction risk across groups of species. It is based on genuine changes in the number of species in each category of extinction risk on The IUCN Red List of Threatened Species (www.iucnredlist.org) is expressed as changes in an index ranging from 0 to 1 where 1 is the maximum contribution that the country or region can make to global species survival, equating to all species being classified as Least Concern on the IUCN Red List, and 0 is the minimum contribution that the country or region can make to global species survival, equating to all species in the country or region having gone extinct.
Model / methods: Threatened species are those listed on The IUCN Red List of Threatened Species in the categories Vulnerable, Endangered, or Critically Endangered (i.e., species that are facing a high, very high, or extremely high risk of extinction in the wild in the medium-term future). Changes over time in the proportion of species threatened with extinction are largely driven by improvements in knowledge and changing taxonomy. The indicator excludes such changes to yield a more informative indicator than the simple proportion of threatened species. It therefore measures change in aggregate extinction risk across groups of species over time, resulting from genuine improvements or deteriorations in the status of individual species. It can be calculated for any representative set of species that have been assessed for The IUCN Red List of Threatened Species at least twice (Butchart et al. 2004, 2005, 2007). To calculate the Red List Index for individual countries and regions, each species contributing to the index is weighted by the proportion of its global range within the particular country or region. The resulting index therefore shows the aggregate extinction risk for species within the country or region relative to its potential contribution to global species extinction risk (within the taxonomic groups included). The Red List Index is based on data from The IUCN Red List of Threatened Species (www.iucnredlist.org), in particular the numbers of species in each Red List category of extinction risk, and changes in these numbers over time resulting from genuine improvements or deteriorations in the status of species. Data on species’ distribution, population size, trends and other parameters that underpin Red List assessments are gathered from published and unpublished sources, species experts, scientists, and conservationists through correspondence, workshops, and electronic fora.
| Scope: | Global |
| Category: | Biodiversity |
| Data type: | xls |
| Resolution: | Global, Regional, National |
| Timepoints: | 1993-2024 |
| Units: | unitless |
Availability: Available to download (search 15.5.1)
Licence: All rights reserved (https://www.un.org/en/about-us/copyright/). See terms of use https://www.un.org/en/about-us/terms-of-use
uP97 Average proportion of Freshwater/Terrestrial Key Biodiversity Areas (KBAs) covered by protected areas (%) ⇑
🌐 https://unstats.un.org/sdgs/dataportal/databaseDescription: The indicator Proportion of important sites for terrestrial and freshwater biodiversity that are covered by protected areas, by ecosystem type shows temporal trends in the mean percentage of each important site for terrestrial and freshwater biodiversity (i.e., those that contribute significantly to the global persistence of biodiversity) that is covered by designated protected areas and Other Effective Area-based Conservation Measures (OECMs). Protected areas, as defined by the IUCN (IUCN; Dudley 2008), are clearly defined geographical spaces, recognized, dedicated and managed, through legal or other effective means, to achieve the long-term conservation of nature with associated ecosystem services and cultural values.
Model / methods: The KBA identification process is highly inclusive and consultative: anyone with data on the biodiversity importance of a site may propose it as a KBA if it meets the KBA criteria, and consultation with stakeholders at the national level (both non-governmental and governmental organisations) is required during the proposal process. Any site proposal must undergo independent review. This is followed by the official site nomination with full documentation meeting the Documentation Standards for KBAs. Sites confirmed by the KBA Secretariat to qualify as KBAs are then published on the KBA Website.
| Scope: | Global |
| Category: | Catchments |
| Data type: | xls |
| Resolution: | Global, Regional, National |
| Timepoints: | 2000-2023 |
| Units: | (%) |
Availability: Available to download (search 15.1.2)
Licence: All rights reserved (https://www.un.org/en/about-us/copyright/). See terms of use https://www.un.org/en/about-us/terms-of-use
uP98 World Database on Protected Areas (WDPA) ⇑
🌐 https://www.protectedplanet.net/en/thematic-areas/wdpa?tab=WDPADescription: The World Database on Protected Areas (WDPA) is the most comprehensive global database of marine and terrestrial protected areas. It is a joint project between UN Environment Programme and the International Union for Conservation of Nature (IUCN), and is managed by UN Environment Programme World Conservation Monitoring Centre (UNEP-WCMC), in collaboration with governments, non-governmental organisations, academia and industry.The WDPA is updated on a monthly basis.
Model / methods: The WDPA is a joint project between UN Environment Programme and the International Union for Conservation of Nature (IUCN). The compilation and management of the WDPA is carried out by UN Environment Programme World Conservation Monitoring Centre (UNEP-WCMC), in collaboration with governments, non-governmental organisations, academia and industry. There are monthly updates of the data which are made available online through the ProtectedPlanet website where the data is both viewable and downloadable.
| Scope: | Global |
| Category: | Catchments |
| Data type: | csv, shp, geodatabase, ESRI web service |
| Resolution: | global |
| Timepoints: | 2020-2024 |
| Units: | km2 |
Availability: Available to download
Licence: Open definition 2.1 https://opendefinition.org/od/2.1/en/
Reference: IUCN and UNEP-WCMC (2020), The World Database on Protected Areas (WDPA) [https://www.protectedplanet.net/en/search-areas?filters%5Bdb_type%5D%5B%5D=wdpa&geo_type=region], [08/2020], Cambridge, UK: UNEP-WCMC. Available at: www.protectedplanet.net.
uP99 Land Surface Runoff ⇑
🌐 https://www.hydrosheds.org/hydroatlasDescription: To support the sustainable development of the world's water resources, the global freshwater model WaterGAP computes water flows and storages as well as water withdrawals and consumptive uses on all continents. It is applied to assess the human – freshwater system under the impact of global change. Discharge and runoff estimates for HydroATLAS are based on long-term (1971–2000) average ‘naturalized’ discharge and runoff values provided by the state-of-the-art global integrated water balance model WaterGAP (Döll et al. 2003, model version 2.2 as of 2014).
Model / methods: WaterGAP is being developed mainly at the Universities of Kassel and Frankfurt (comp. Wikipedia article). Its development and applications are documented in a large number of publications. The WaterGAP data were spatially downscaled from their original 0.5 degree pixel resolution (~50 km at the equator) to the 15 arc-second (~500 m) resolution of the HydroSHEDS river network using geo-statistical techniques (Lehner and Grill 2013). Preliminary tests against approximately 3000 global gauging stations indicate a good overall correlation for the long-term averages, but also reveal larger uncertainties for areas that are dominated by snow, glaciers, wetlands, and (semi-)arid conditions
| Scope: | Global |
| Category: | Catchments |
| Resolution: | 15 arc sec |
| Timepoints: | 1971–2000 |
| Units: | mm/day |
Availability: Available to download (in BASINAtlas)
Licence: Creative Commons CC-BY 4.0
Reference: Döll, P., Kaspar, F., Lehner, B. (2003). A global hydrological model for deriving water availability indicators: model tuning and validation. Journal of Hydrology, 270, 105-134
uP100 Land cover classes and extent ⇑
🌐 https://www.hydrosheds.org/hydroatlas🌐 https://forobs.jrc.ec.europa.eu/products/glc2000/glc2000.php
Description: The GLC2000 (Global Land Cover in the year 2000) database distinguishes 22 land cover classes.
Model / methods: Produced by an international partnership of 30 research groups coordinated by the European Commission’s Joint Research Centre. Land cover maps were based on daily data from the SPOT vegetation sensor (VEGA 2000 dataset: a dataset of 14 months of pre-processed daily global data acquired by the VEGETATION instrument on board the SPOT 4 satellite) and other Earth observing sensors. The general objective was to provide a harmonized land cover database over the whole globe for the year 2000. The year 2000 is considered as a reference year for environmental assessment in relation to various activities, in particular the United Nation's Ecosystem-related International Conventions
| Scope: | Global |
| Category: | Catchments |
| Resolution: | 30 arc sec |
| Timepoints: | 2000 |
| Units: | class and spatial exent (% cover) by class |
Availability: Available to download (in BASINAtlas)
Licence: Creative Commons CC-BY 4.0
Reference: Bartholomé, E., Belward, A.S. (2005). GLC2000: a new approach to global land cover mapping from Earth observation data. International Journal of Remote Sensing, 26(9), 1959-1977
uP101 Potential natural vegetation classes and extent ⇑
🌐 https://www.hydrosheds.org/hydroatlas🌐 https://nelson.wisc.edu/sage/data-and-models/global-potential-vegetation/index.php
Description: The EarthStat database includes a global map of natural vegetation classified into 15 vegetation types. It is representative of the world’s vegetation that would most likely exist now in the absence of human activities. In regions not dominated by human land use, vegetation types are those currently observed from a satellite
Model / methods: This data set is derived mainly from the DISCover land cover data set, with the regions dominated by antrhopogenic land use filled using the vegetation data set of Haxeltine and Prentice (1996)
| Scope: | Global |
| Category: | Catchments |
| Resolution: | 5 arc-min grid |
| Timepoints: | 1700-1992 |
| Units: | class and spatial exent (% cover) by class |
Availability: Available to download (in BASINAtlas)
Licence: Creative Commons CC-BY 4.0
Reference: Ramankutty, N., Foley, J.A. (1999). Estimating historical changes in global land cover: Croplands from 1700 to 1992. Global Biogeochemical Cycles, 13(4), 997-1027
uP102 GLW 4: Gridded Livestock Density ⇑
🌐 https://data.amerigeoss.org/dataset/9d1e149b-d63f-4213-978b-317a8eb42d02Description: This dataset contains the most up to date version of GLW 4 for the reference year 2020 for the following species: buffalo, cattle, sheep, goats, pigs and chicken. The individual species datasets are available at global extent and 5 minutes of arc resolution (approx. 10 km at the equator). The fourth version of GLW, compared to the previous ones, reflects the most recently compiled and harmonized subnational livestock distribution data and much more detailed metadata. The layers contain the density of animals per km².
Model / methods: Random forest model
| Scope: | Global |
| Category: | Nutrients |
| Data type: | Float64 |
| Resolution: | Global, 5 arc minutes (~10km at equator) |
| Timepoints: | 2020 |
| Units: | head/pixel or birds/pixel |
Availability: Available to download (in BASINAtlas)
Licence: Creative Commons Attribution 4.0 International License (Public-use data under the CC BY-NC-SA 3.0 IGO license)
uP103 Global phosphorus losses due to soil erosion ⇑
🌐 https://esdac.jrc.ec.europa.eu/content/global-phosphorus-losses-due-soil-erosionDescription: Global average phosphorus (P) losses due to soil erosion in kg ha−1 yr−1. Thus we combine the most recent spatially distributed global soil erosion estimates with global P content of cropland soils (data also available for P content). We cover 1.04 billion ha of global cropland with a resolution of 0.5°×0.5° based on the land-use harmonization data. In addition, we also provide the the total land cover (and the study area part) with the % expessing how much is the fraction of croplands in the pixel.
Model / methods: The modelling approach used to compute soil P pools are described in Ringeval et al. (2017
| Scope: | Global |
| Category: | Nutrients |
| Resolution: | 0.5°×0.5° |
| Timepoints: | 2012 |
| Units: | kgP ha-1 yr-1 |

Availability: Available to download but needs registration and submission of request form
Licence: The permission to use the data specified above is granted on condition that, under NO CIRCUMSTANCES are these data passed to third parties. They can be used for any purpose, including commercial gain. The user agrees to: - make proper reference to the source of the data when disseminating the results to which this agreement relates; - Participate in the verification of the data (e.g. by noting and reporting any errors or omissions discovered to the JRC).
Reference: Alewell, C., Ringeval, B., Ballabio, C., Robinson, D.A., Panagos, P., Borrelli, P. 2020. Global phosphorus shortage will be aggravated by soil erosion. Nat Commun 11, 4546. https://doi.org/10.1038/s41467-020-18326-7
uP104 UN countries ⇑
🌐 https://geoportal.un.org/arcgis/home/item.html?id=fa74ef8499094e41bf0d025006e37fc9#overviewDescription: The United Nations Geospatial Data, or Geodata, is a worldwide geospatial dataset of the United Nations.The United Nations Geodata is provided to facilitate the preparation of cartographic materials in the United Nations includes geometry, attributes and labels to facilitate the adequate depiction and naming of geographic features for the preparation of maps in accordance with United Nations policies and practices. The geospatial datasets here included are referred to as UN Geodata simplified and are generalized based on UNGeodata 25 million scale. The feature layers include polygons/areas of countries (BNDA_simplified), lines for international boundaries and limits (BNDL_simplified), and major water body (WBYA_simplified). In addition, aggregated regional areas are available following M49 methodology (GEOA_simplified, SUBA_simplified, INTA_simplified) and SDG regional grouping (SDGA_simplified).
Model / methods: The UN Geodata simplified is prepared in the context of the Administrative Instruction on the “Guidelines for the Publication of Maps” and should serve global mapping purposes as opposed to local mapping. The scale is unspecific for the United Nations Geodata simplified and is suitable for generalized world maps and web-maps.
| Scope: | Global |
| Category: | Demographic |
| Data type: | polygon layers |
| Resolution: | country |
Availability: Available to download
Licence: The boundaries and names shown and the designations used on this map do not imply official endorsement or acceptance by the United Nations. (short form)The designations employed and the presentation of material on this map do not imply the expression of any opinion whatsoever on the part of the Secretariat of the United Nations concerning the legal status of any country, territory, city or area or of its authorities, or concerning the delimitation of its frontiers or boundaries. (long form)Final boundary between the Republic of Sudan and the Republic of South Sudan has not yet been determined.Dotted line represents approximately the Line of Control in Jammu and Kashmir agreed upon by India and Pakistan. The final status of Jammu and Kashmir has not yet been agreed upon by the parties.A dispute exists between the Governments of Argentina and the United Kingdom of Great Britain and Northern Ireland concerning sovereignty over the Falkland Islands (Malvinas).* Non-Self-Governing-Territories
Reference: United Nations Geospatial
Country-specific Datasets
uP33 Nutrient Explorer ⇑
🌐 https://cfpub.epa.gov/si/si_public_record_Report.cfm?dirEntryId=358039&Lab=CPHEADescription: A Downloadable R Shiny Analytical Framework to Visualize and Investigate Drivers of Surface Water Quality (Version 1.0)
Model / methods: For this UI we utilized total phosphorus (TP) concentrations measurements from lakes in 17 northern midwestern and northeastern U.S. states (LAGOS-NE), which were combined with watershed-scale landscape metrics. The UI can we create visualizations of the datasets and relationships across space and time. The UI can also develop random forest and multilinear regression models to determine which factors best explain spatial variability in TP and where lake TP is highest across the Upper Midwest and Northeast U.S.
| Scope: | Country-specific |
| Category: | Nutrients |
| Data type: | Rshiny |
| Resolution: | U.S. states |
| Timepoints: | 2023 |
| Units: | TP (μg/L) and TN (μg/L) |

Availability: Available to download
Licence: Copyright (c) 2019 U.S. Federal Government (in countries where recognized) MIT License here: https://github.com/USEPA/NutrientExplorer?tab=MIT-1-ov-file
Reference: Pennino, M., M. Fry, R. Sabo, AND Jim Carleton. Nutrient Explorer: A Downloadable R Shiny Analytical Framework to Visualize and Investigate Drivers of Surface Water Quality (Version 1.0). U.S. Environmental Protection Agency, Washington, DC, 2023.
Chile Datasets
uP58 Terrestrial ecosystems (SIMBIO) ⇑
🌐 https://simbio.mma.gob.cl/EcosistemasDescription: Information on all terrestrial ecosystems of Chile, such as Andean mediterranean deciduous forest, coastal mediterranean deciduous forest, mediterranean temperate forest, Andean temperate deciduous forest etc. Includes ecosystem description, terrestrial ecosystem ID, ecosystem dynamics, bioclimate, thermotype, political-administrative division, basin, dominant native vegetation, summary of protected areas, zonal, inter-zonal and extra-zonal communities, and a map of the latitudinal gradient.
Model / methods: The Biodiversity Information and Monitoring System – SIMBIO, is an initiative of the Ministry of the Environment that aims to provide free access to information on the biological diversity of the national territory for the construction of a sustainable society. It is based on Article 70 letters f, j and k of law 19,300. SYMBIO v1 was financed by the Chile-Mexico Joint Cooperation Fund through the project Technology transfer between Mexico and Chile for institutional strengthening in the context of climate change and within the framework of the creation of the Biodiversity and Protected Areas Service of Chile. It includes the modules on protected areas, marine and terrestrial ecosystems, RECOGE plans, ecological restoration initiatives and wetlands, as well as a geoportal with functionalities for basic analysis.
| Scope: | Chile |
| Category: | Catchments |
| Data type: | Excel |
| Resolution: | region, sub-region, basin, sub-basin |
| Units: | see excel |

Availability: Available to download
Licence: Chilean Ministry of Environment
uP59 Marine ecosystems ⇑
🌐 https://simbio.mma.gob.cl/EcosistemasMarinosDescription: Information on all marine ecosystems of Chile, such as abyss, channels, coast, epibenthic etc. Includes ecosystem description, marine ecosystem ID, ecoregions, zone, ecosystem area, chemical characteristics of water, substrate and sediment, number of freshwater inlets, protected areas, and a map of the latitudinal gradient.
Model / methods: The Biodiversity Information and Monitoring System – SIMBIO, is an initiative of the Ministry of the Environment that aims to provide free access to information on the biological diversity of the national territory for the construction of a sustainable society. It is based on Article 70 letters f, j and k of law 19,300. SYMBIO v1 was financed by the Chile-Mexico Joint Cooperation Fund through the project Technology transfer between Mexico and Chile for institutional strengthening in the context of climate change and within the framework of the creation of the Biodiversity and Protected Areas Service of Chile. It includes the modules on protected areas, marine and terrestrial ecosystems, RECOGE plans, ecological restoration initiatives and wetlands, as well as a geoportal with functionalities for basic analysis.
| Scope: | Chile |
| Category: | Catchments |
| Data type: | Excel |
| Resolution: | ecoregion |
| Units: | see excel |
Availability: Available to download
Licence: Chilean Ministry of Environment
uP60 Wetlands ⇑
🌐 https://simbio.mma.gob.cl/HumedalesDescription: Information on wetlands including ecosystems, management, boundaries and cartography.
Model / methods: The Biodiversity Information and Monitoring System – SIMBIO, is an initiative of the Ministry of the Environment that aims to provide free access to information on the biological diversity of the national territory for the construction of a sustainable society. It is based on Article 70 letters f, j and k of law 19,300. SYMBIO v1 was financed by the Chile-Mexico Joint Cooperation Fund through the project Technology transfer between Mexico and Chile for institutional strengthening in the context of climate change and within the framework of the creation of the Biodiversity and Protected Areas Service of Chile. It includes the modules on protected areas, marine and terrestrial ecosystems, RECOGE plans, ecological restoration initiatives and wetlands, as well as a geoportal with functionalities for basic analysis.
| Scope: | Chile |
| Category: | Catchments |
| Data type: | Excel |
| Resolution: | region, province,commune |
| Units: | see excel |
Availability: Available to download
Licence: Chilean Ministry of Environment
uP61 Species restoration, conservation and management ⇑
🌐 https://simbio.mma.gob.cl/PlanesRecogeDescription: Information on conservation plans for several species (land birds, red canquen, short tailed chinchilla, white shearwater, coastal flora of northern chile, lion's claw etc). Includes description of the plan, proponent of the plan, plan status, environments, political-administrative division, basin, normative, biodiversity information (on the species), threats, action plan, boundaries and cartography
Model / methods: The Biodiversity Information and Monitoring System – SIMBIO, is an initiative of the Ministry of the Environment that aims to provide free access to information on the biological diversity of the national territory for the construction of a sustainable society. It is based on Article 70 letters f, j and k of law 19,300. SYMBIO v1 was financed by the Chile-Mexico Joint Cooperation Fund through the project Technology transfer between Mexico and Chile for institutional strengthening in the context of climate change and within the framework of the creation of the Biodiversity and Protected Areas Service of Chile. It includes the modules on protected areas, marine and terrestrial ecosystems, RECOGE plans, ecological restoration initiatives and wetlands, as well as a geoportal with functionalities for basic analysis.
| Scope: | Chile |
| Category: | Catchments |
| Data type: | Excel |
| Resolution: | region, basin |
| Units: | see excel |
Availability: Available to download
Licence: Chilean Ministry of Environment
uP62 Ecological restoration ⇑
🌐 https://simbio.mma.gob.cl/RestauracionEcologicaDescription: Information on different restoration plans, including full name of the initiative, summary of the initiative, ecosystem, management, species, boundaries and cartography
Model / methods: The Biodiversity Information and Monitoring System – SIMBIO, is an initiative of the Ministry of the Environment that aims to provide free access to information on the biological diversity of the national territory for the construction of a sustainable society. It is based on Article 70 letters f, j and k of law 19,300. SYMBIO v1 was financed by the Chile-Mexico Joint Cooperation Fund through the project Technology transfer between Mexico and Chile for institutional strengthening in the context of climate change and within the framework of the creation of the Biodiversity and Protected Areas Service of Chile. It includes the modules on protected areas, marine and terrestrial ecosystems, RECOGE plans, ecological restoration initiatives and wetlands, as well as a geoportal with functionalities for basic analysis.
| Scope: | Chile |
| Category: | Catchments |
| Data type: | Excel |
| Resolution: | region, province,commune |
| Units: | see excel |
Availability: Available to download
Licence: Chilean Ministry of Environment
uP63 Species taxonomy ⇑
🌐 https://simbio.mma.gob.cl/EspeciesDescription: Information on species taxonomy, conservation status and associated regulations. Distribution, morphology, natural history and threats
Model / methods: The Biodiversity Information and Monitoring System – SIMBIO, is an initiative of the Ministry of the Environment that aims to provide free access to information on the biological diversity of the national territory for the construction of a sustainable society. It is based on Article 70 letters f, j and k of law 19,300. SYMBIO v1 was financed by the Chile-Mexico Joint Cooperation Fund through the project Technology transfer between Mexico and Chile for institutional strengthening in the context of climate change and within the framework of the creation of the Biodiversity and Protected Areas Service of Chile. It includes the modules on protected areas, marine and terrestrial ecosystems, RECOGE plans, ecological restoration initiatives and wetlands, as well as a geoportal with functionalities for basic analysis.
| Scope: | Chile |
| Category: | Biodiversity |
| Data type: | Excel or csv |
| Resolution: | region, province,commune |
| Units: | see excel |
Availability: Available to download
Reference: Ministry of the Environment. 2024. [ADD SPECIES NAME] species sheet ([ADD SURNAME AND DATE, see Bibliography and Collaboration tab for each species) . https://simbio.mma.gob.cl/Especies/Details/8
uP64 Protected areas ⇑
🌐 https://simbio.mma.gob.cl/CbaAPDescription: Information about coastal marine protected areas, natural monuments, national parks etc, including general informaton and importance, regulations, ecosystem and species, boundaries and cartography
Model / methods: The Biodiversity Information and Monitoring System – SIMBIO, is an initiative of the Ministry of the Environment that aims to provide free access to information on the biological diversity of the national territory for the construction of a sustainable society. It is based on Article 70 letters f, j and k of law 19,300. SYMBIO v1 was financed by the Chile-Mexico Joint Cooperation Fund through the project Technology transfer between Mexico and Chile for institutional strengthening in the context of climate change and within the framework of the creation of the Biodiversity and Protected Areas Service of Chile. It includes the modules on protected areas, marine and terrestrial ecosystems, RECOGE plans, ecological restoration initiatives and wetlands, as well as a geoportal with functionalities for basic analysis.
| Scope: | Chile |
| Category: | Catchments |
| Data type: | Excel or csv |
| Resolution: | region, province,commune |
| Units: | see excel |
Availability: Available to download
Licence: Chilean Ministry of Environment
uP65 Areas of other designations ⇑
🌐 https://simbio.mma.gob.cl/CbaODDescription: Information on areas of different designations, such as protected national asset, conservation landscape, biosphere reserve etc., including general informaton and importance, regulations, ecosystem and species, boundaries and cartography
Model / methods: The Biodiversity Information and Monitoring System – SIMBIO, is an initiative of the Ministry of the Environment that aims to provide free access to information on the biological diversity of the national territory for the construction of a sustainable society. It is based on Article 70 letters f, j and k of law 19,300. SYMBIO v1 was financed by the Chile-Mexico Joint Cooperation Fund through the project Technology transfer between Mexico and Chile for institutional strengthening in the context of climate change and within the framework of the creation of the Biodiversity and Protected Areas Service of Chile. It includes the modules on protected areas, marine and terrestrial ecosystems, RECOGE plans, ecological restoration initiatives and wetlands, as well as a geoportal with functionalities for basic analysis.
| Scope: | Chile |
| Category: | Catchments |
| Data type: | Excel or csv |
| Resolution: | region, province,commune |
| Units: | see excel |
Availability: Available to download
Licence: Chilean Ministry of Environment
uP66 Priority sites ⇑
🌐 https://simbio.mma.gob.cl/CbaSPDescription: Information on priority sites, including description, regulations, species, management, boundaries and cartography, resources etc
Model / methods: The Biodiversity Information and Monitoring System – SIMBIO, is an initiative of the Ministry of the Environment that aims to provide free access to information on the biological diversity of the national territory for the construction of a sustainable society. It is based on Article 70 letters f, j and k of law 19,300. SYMBIO v1 was financed by the Chile-Mexico Joint Cooperation Fund through the project Technology transfer between Mexico and Chile for institutional strengthening in the context of climate change and within the framework of the creation of the Biodiversity and Protected Areas Service of Chile. It includes the modules on protected areas, marine and terrestrial ecosystems, RECOGE plans, ecological restoration initiatives and wetlands, as well as a geoportal with functionalities for basic analysis.
| Scope: | Chile |
| Category: | Catchments |
| Data type: | Excel or csv |
| Resolution: | region, province,commune |
| Units: | see excel |
Availability: Available to download
Licence: Chilean Ministry of Environment
uP67 Private conservation sites ⇑
🌐 https://simbio.mma.gob.cl/CbaCPDescription: Information on private and community conservation sites, including description, regulations, species, management, boundaries and cartography, resources etc
Model / methods: The Biodiversity Information and Monitoring System – SIMBIO, is an initiative of the Ministry of the Environment that aims to provide free access to information on the biological diversity of the national territory for the construction of a sustainable society. It is based on Article 70 letters f, j and k of law 19,300. SYMBIO v1 was financed by the Chile-Mexico Joint Cooperation Fund through the project Technology transfer between Mexico and Chile for institutional strengthening in the context of climate change and within the framework of the creation of the Biodiversity and Protected Areas Service of Chile. It includes the modules on protected areas, marine and terrestrial ecosystems, RECOGE plans, ecological restoration initiatives and wetlands, as well as a geoportal with functionalities for basic analysis.
| Scope: | Chile |
| Category: | Catchments |
| Data type: | Excel or csv |
| Resolution: | region, province,commune |
| Units: | see excel |
Availability: Available to download
Licence: Chilean Ministry of Environment
uP68 Catchments, subcatchments and sub-sub-catchments ⇑
🌐 https://simbio.mma.gob.cl/ModuloCuencasDescription: Information on catchments, subcatchments and sub-subcatchments including description, regulations, species, biodiversity management, boundaries and cartography, resources etc
Model / methods: The Biodiversity Information and Monitoring System – SIMBIO, is an initiative of the Ministry of the Environment that aims to provide free access to information on the biological diversity of the national territory for the construction of a sustainable society. It is based on Article 70 letters f, j and k of law 19,300. SYMBIO v1 was financed by the Chile-Mexico Joint Cooperation Fund through the project Technology transfer between Mexico and Chile for institutional strengthening in the context of climate change and within the framework of the creation of the Biodiversity and Protected Areas Service of Chile. It includes the modules on protected areas, marine and terrestrial ecosystems, RECOGE plans, ecological restoration initiatives and wetlands, as well as a geoportal with functionalities for basic analysis.
| Scope: | Chile |
| Category: | Catchments |
| Data type: | webpage |
| Resolution: | region, province,commune |
Availability: Available to download
Licence: Chilean Ministry of Environment
uP69 Regions, provinces and communes ⇑
🌐 https://simbio.mma.gob.cl/DPADescription: Information on catchments, subcatchments and sub-subcatchments including description, regulations, species, biodiversity management, boundaries and cartography, resources etc
Model / methods: The Biodiversity Information and Monitoring System – SIMBIO, is an initiative of the Ministry of the Environment that aims to provide free access to information on the biological diversity of the national territory for the construction of a sustainable society. It is based on Article 70 letters f, j and k of law 19,300. SYMBIO v1 was financed by the Chile-Mexico Joint Cooperation Fund through the project Technology transfer between Mexico and Chile for institutional strengthening in the context of climate change and within the framework of the creation of the Biodiversity and Protected Areas Service of Chile. It includes the modules on protected areas, marine and terrestrial ecosystems, RECOGE plans, ecological restoration initiatives and wetlands, as well as a geoportal with functionalities for basic analysis.
| Scope: | Chile |
| Category: | Catchments |
| Data type: | webpage |
| Resolution: | region, province,commune |
Availability: Available to download
Licence: Chilean Ministry of Environment
uP70 Water Agency probe data ⇑
🌐 https://snia.mop.gob.cl/dgasat/pages/dgasat_param/dgasat_param.jsp?param=1Description: Hourly, mean, max and min daily water level, water temperature, flow rate, accumulation precipitatoin, air temperature, humidity, instant precipitation etc. (depending on stations at which measurement taken)
Model / methods: The General Directorate of Water (DGA) is the State agency in charge of ensuring balance and harmony in the use of terrestrial waters, promoting and strengthening their governance, safeguarding their preservation and availability in quality and quantity for sustainable, resilient development, inclusive, participatory and with a gender perspective, caring for people and improving their quality of life.
| Scope: | Chile |
| Category: | Catchments |
| Data type: | Excel |
| Resolution: | stations |
| Timepoints: | up to 2024 |
Availability: Available unless data is temporary and subject to modifications
uP71 Regional land use ⇑
🌐 https://sit.conaf.cl/Description: Regional land use information including: total area of prairies, plantations, forests (native, mixed etc) etc. Base vector information (administrative limits, hydrography, roads etc)
Model / methods: Department of Forest ecosystem monitoring
| Scope: | Chile |
| Category: | Catchments |
| Data type: | shapefiles and in webpage |
| Resolution: | region |
| Timepoints: | 1997-2020 |
| Units: | hectares |
Availability: Available to download
Licence: Copyright © 2020 CONAF
uP72 Biodiversity (species presence/absence, ecosystem classification, protected areas, etc.) ⇑
🌐 https://apps.mma.gob.cl/visorsimbioDescription: Geoportal with different layers that can be selected and displayed: protected areas, political-administrative division, hydrological catchments, ecosystems (terrestrial and marine), conservation plans, ecological restoration initiatives, wetlands, landuse, species (GBIF) etc.
Model / methods: The Biodiversity Information and Monitoring System – SIMBIO, is an initiative of the Ministry of the Environment that aims to provide free access to information on the biological diversity of the national territory for the construction of a sustainable society. It is based on Article 70 letters f, j and k of law 19,300. SYMBIO v1 was financed by the Chile-Mexico Joint Cooperation Fund through the project Technology transfer between Mexico and Chile for institutional strengthening in the context of climate change and within the framework of the creation of the Biodiversity and Protected Areas Service of Chile. It includes the modules on protected areas, marine and terrestrial ecosystems, RECOGE plans, ecological restoration initiatives and wetlands, as well as a geoportal with functionalities for basic analysis.
| Scope: | Chile |
| Category: | Catchments |
| Data type: | shapefile, GeoJSON, file geodatabase |
| Resolution: | country |
| Units: | depending on layer |
Availability: Available to download
uP80 Chile Boundaries (various) ⇑
Description: Chilean boundaries from a number of different sources, including country outline and administrative boundaries.
| Scope: | Chile |
| Category: | Demographic |
Availability: Contact Philip Taylor (philor@ceh.ac.uk)
uP81 Chile Catchments ⇑
Description: Chilean lakes, outlets, and catchments derived from HydroLakes (LakeATLAS) and Lake-TopoCat.
| Scope: | Chile |
| Category: | Catchments |
Availability: Contact Philip Taylor (philor@ceh.ac.uk)